Belgian organic search shifted significantly in 2025 due to Google updates prioritising helpful content, UX, and intent relevance.
SISTRIX Visibility Index was used to measure SEO performance trends, not traffic, across Belgian Google results.
Visibility changes are best read as momentum signals, not absolute performance or revenue impact.
Google rewarded platforms with user generated content, expert depth, strong internal linking, and scalable category structures.
Biggest SEO winners were Reddit, large retailers, and content platforms aligned with real user intent and discovery queries.
Retail, grocery, DIY, and sports brands grew through strong category coverage and transactional plus informational content.
Video and visual platforms like YouTube and Instagram gained from deeper SERP integration.
Biggest SEO losers were dictionary sites, directories, and media platforms with duplicated or low differentiation content.
Utility sites lost visibility as Google surfaced more answers directly in SERPs.
Wikipedia remained by far the most dominant domain in Belgian search.
The Belgian top 10 domains stayed stable, with no entries or exits, despite internal ranking shifts.
Key lesson for 2026: SEO growth comes from aligning technical foundations, content depth, and search intent as one system, not isolated optimisations
In 2025, the landscape of organic search in Belgium underwent significant shifts, driven by both algorithm evolution and changing user behaviour. As Google continues refining its ranking systems, placing greater weight on helpful content, user experience, and relevance across informational and transactional queries, the distribution of visibility across domains tells a compelling story of winners and losers in the Belgian search ecosystem.
What is SISTRIX and the Visibility Index
SISTRIX is an SEO intelligence platform used by marketers and SEO teams to monitor organic search performance. Instead of tracking a single keyword or ranking, SISTRIX aggregates millions of keyword rankings and converts them into a single metric called the Visibility Index.
The Visibility Index represents how visible a domain is in Google search results based on:
The number of keywords it ranks for
The positions of those keywords
The estimated click potential of each ranking
A rising Visibility Index indicates stronger organic presence. A falling index usually signals ranking losses, algorithm impact, or reduced keyword coverage. The index is relative, meaning it is most useful for trend analysis and comparisons over time.
If you want to diagnose visibility swings like these, they usually come down to indexability, content quality signals, internal linking, and technical performance.
Dataset and methodology
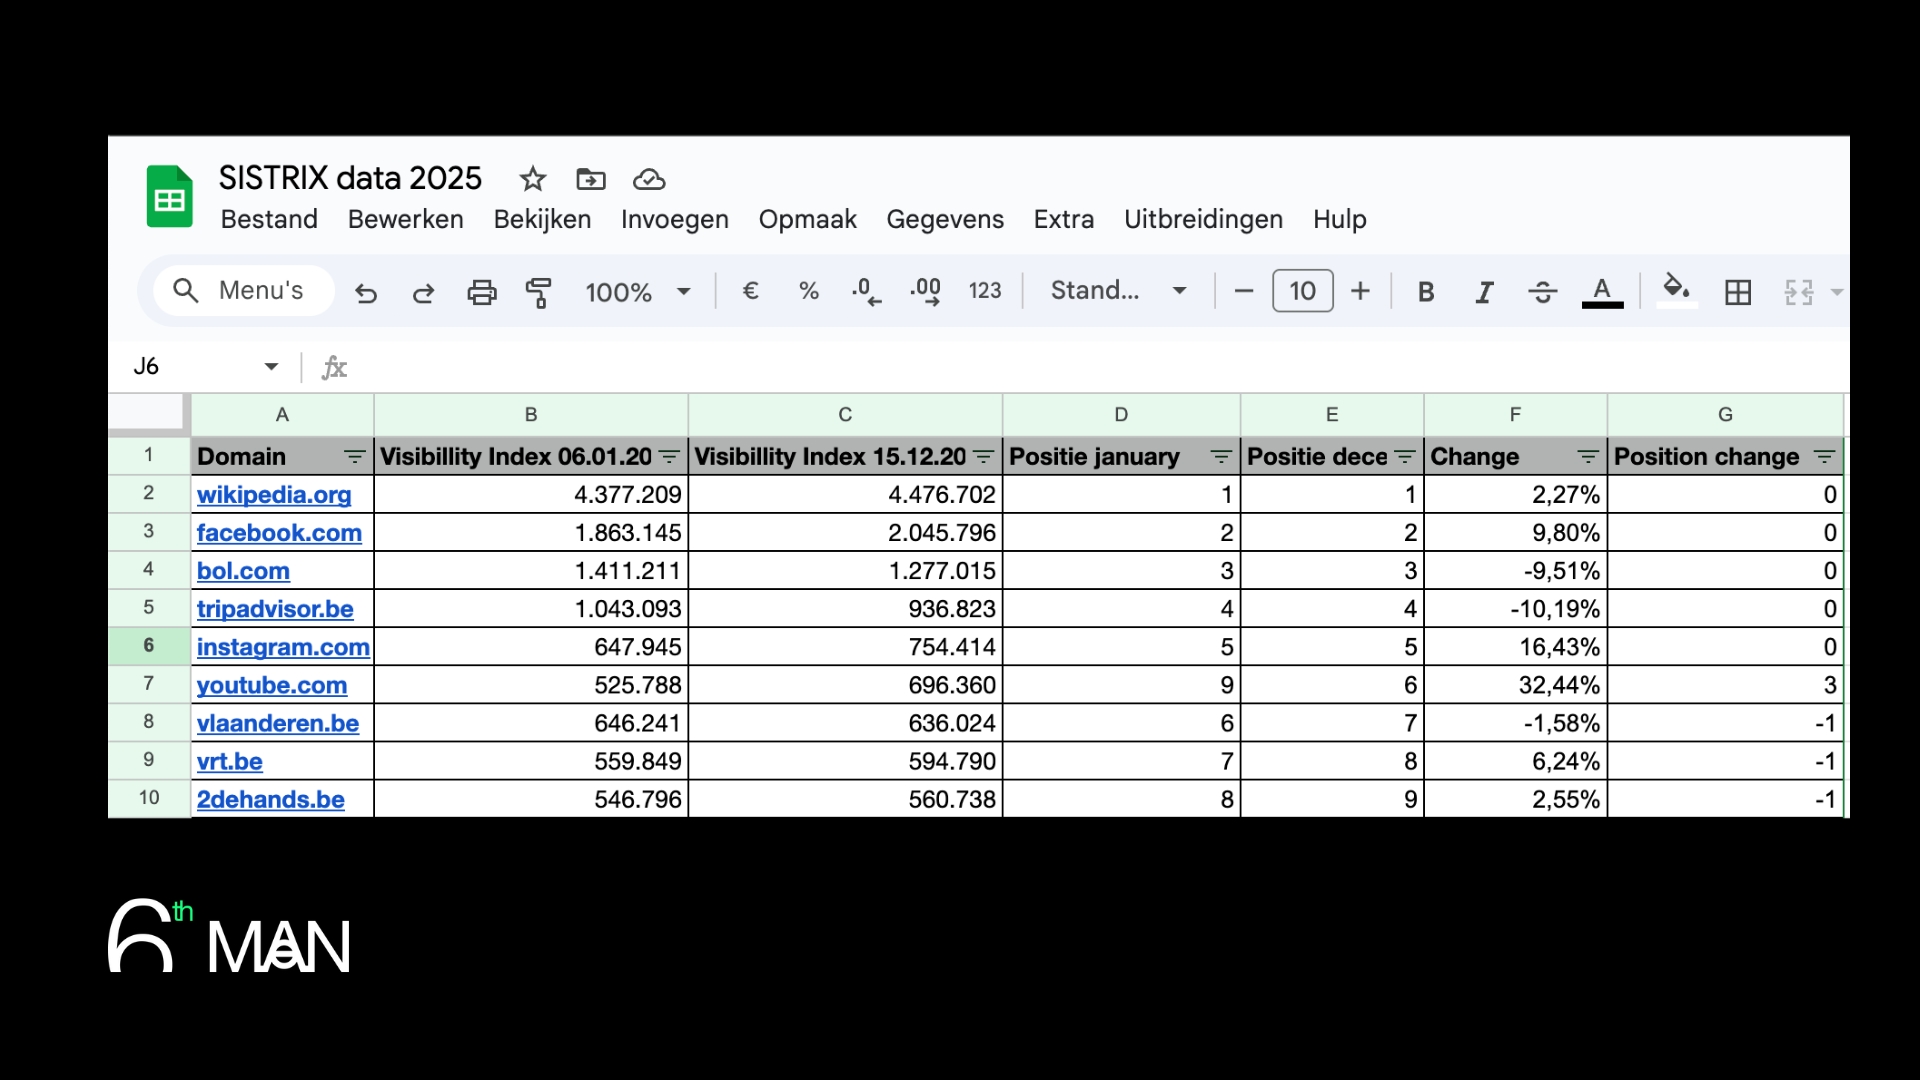
For this analysis, we used SISTRIX visibility data for the Belgian Google index.
SISTRIX data sheet. This is the data this report is based on.
Methodology caveat
The Visibility Index is a relative indicator, not a traffic metric. Percentage growth can be misleading when starting from a smaller baseline. A domain growing from 50 to 100 visibility shows 100 percent growth, but remains smaller in absolute impact than a domain growing from 500 to 600.
For that reason:
Winners and losers are ranked by percentage change to highlight momentum
The final Top 10 domains are ranked by absolute visibility to show market dominance
Both views are required to correctly interpret SEO performance.
Google algorithm context
The 2025 movements should be interpreted in the context of Google’s ongoing algorithm updates, particularly:
Increased weighting of user generated and discussion based content
The winners below are ranked by percentage growth in Sistrix Visibility Index between January 6, 2025 and December 15, 2025.
Reddit SEO performance in 2025
Largest overall SEO winner of 2025
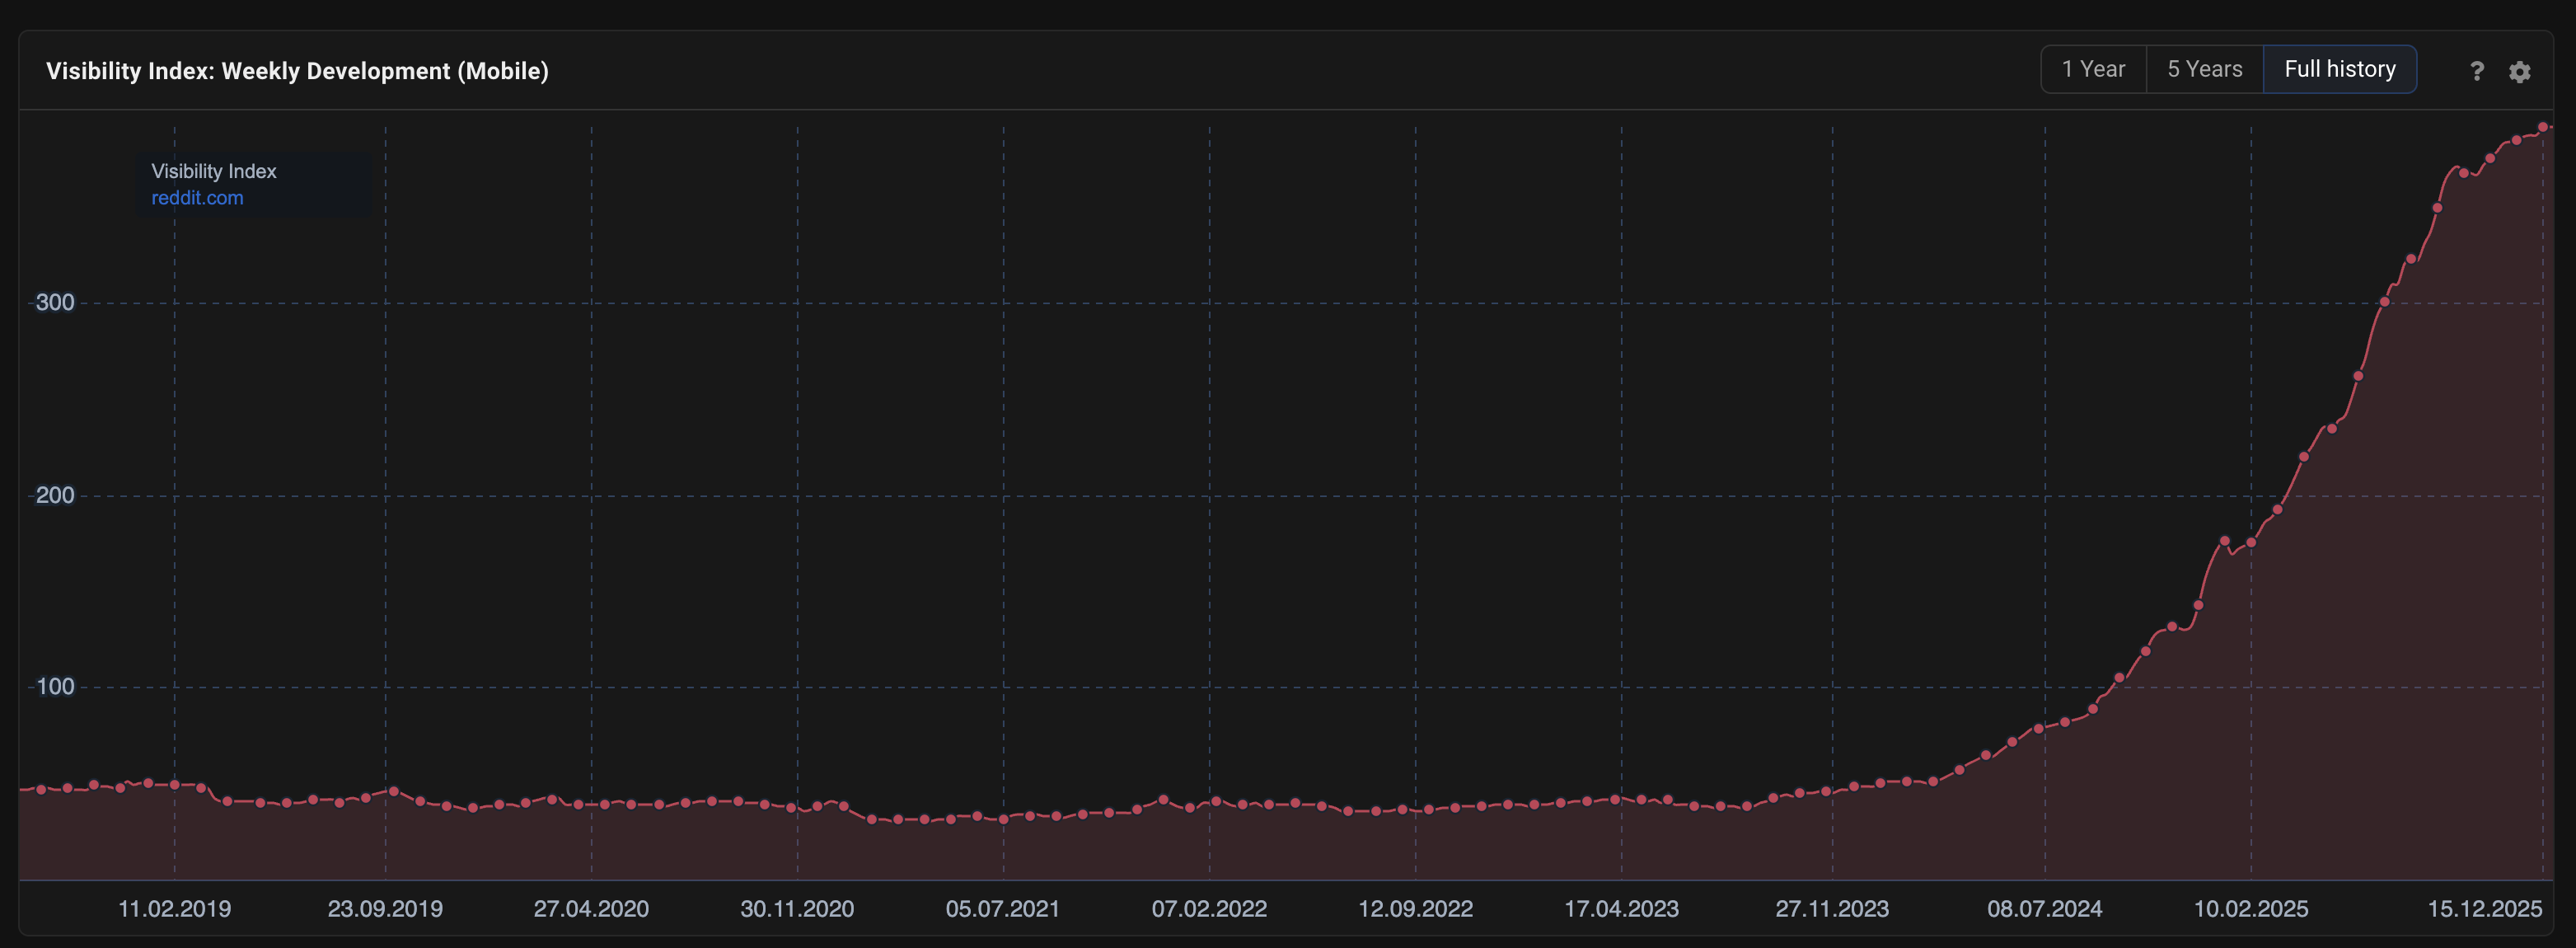
Reddit.com is a global discussion platform built around user generated communities. In 2025, Reddit increased its Visibility Index from 173.29 to 391.71, a growth of +126.0 percent. This aligns closely with Google’s increased emphasis on first-hand experience and authentic discussion based answers.
The spectacular growth of Reddit through SISTRIX visibility index.
Kruidvat SEO performance in 2025
Strongest Belgian retail SEO growth
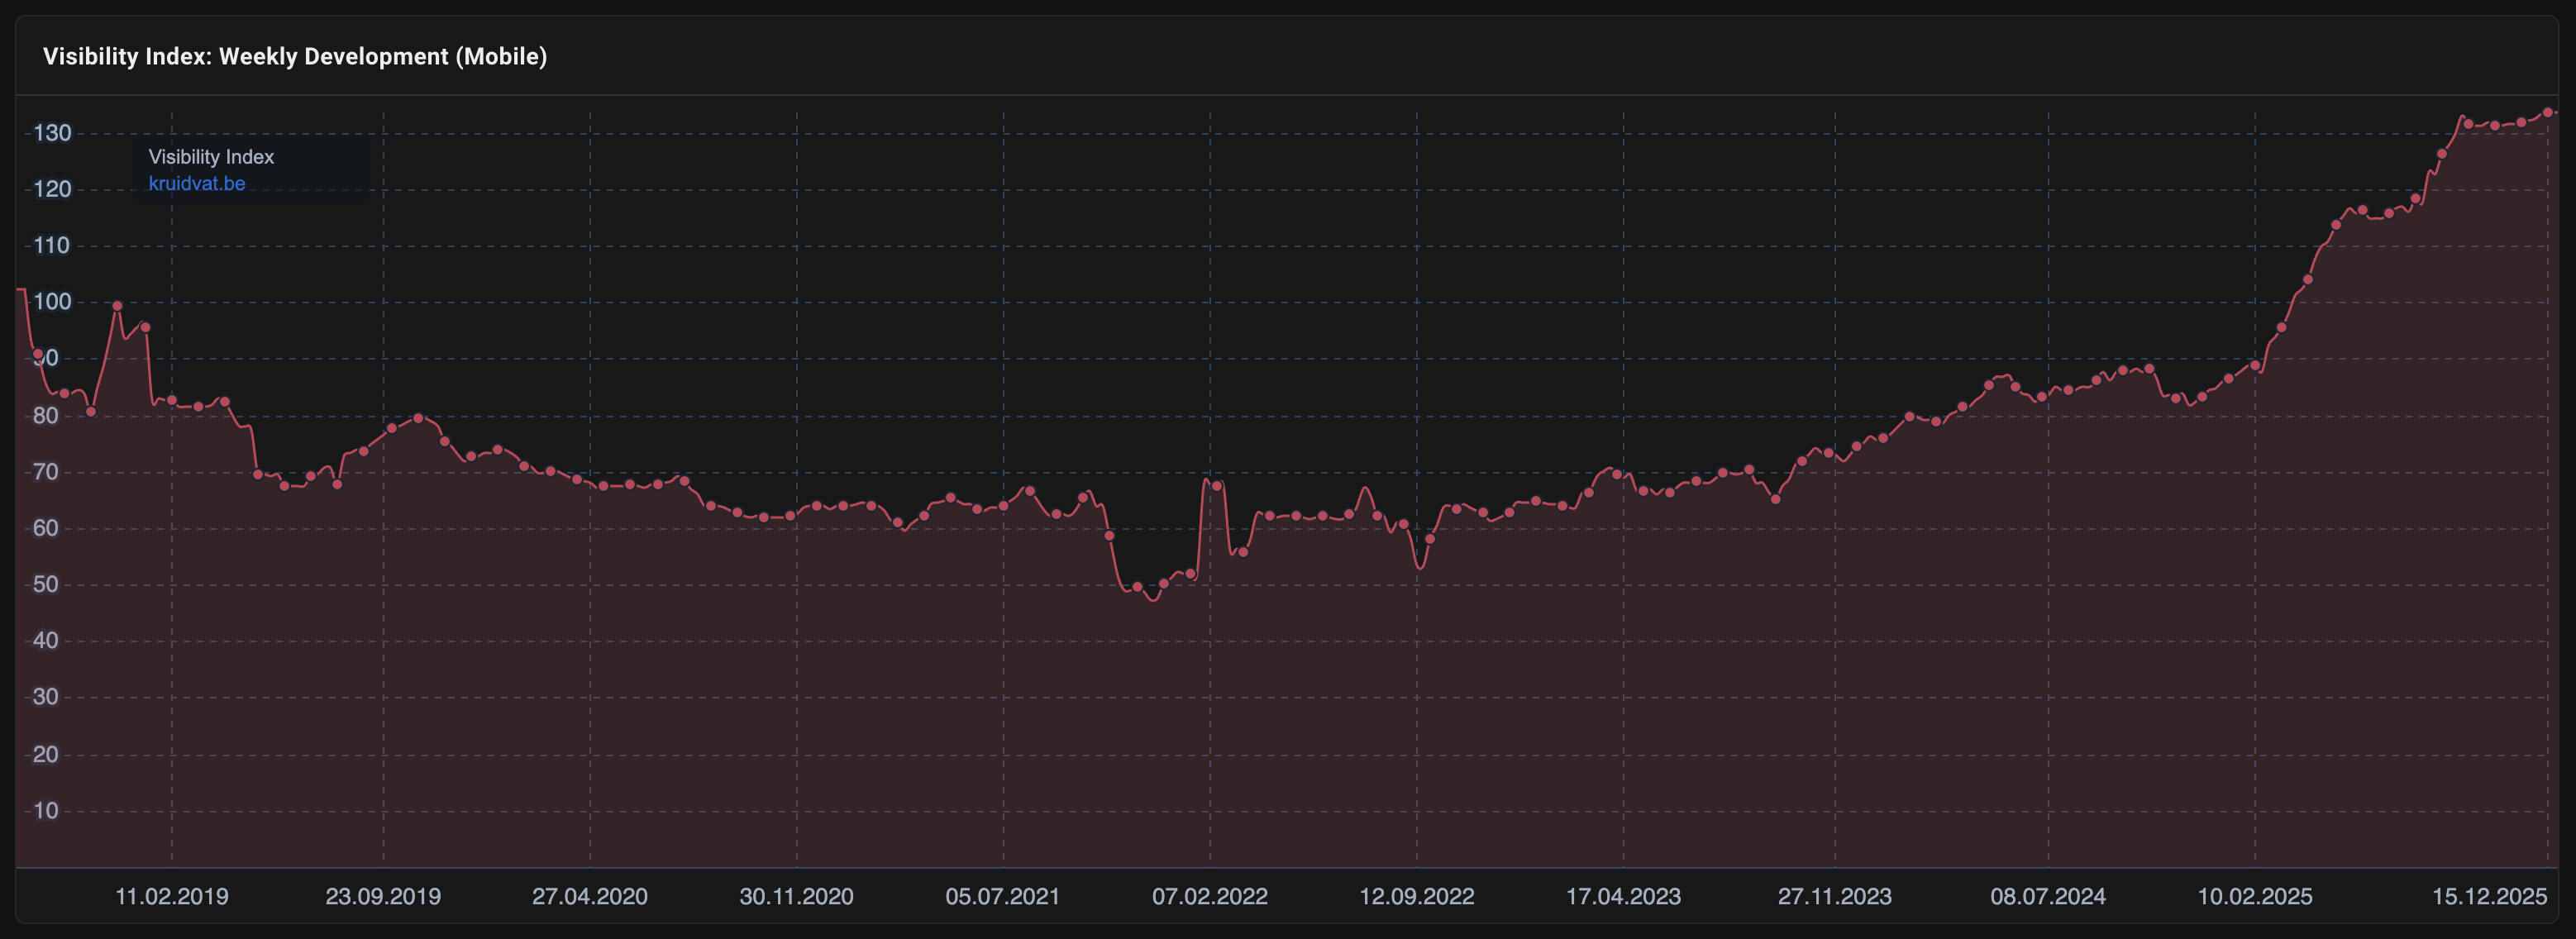
Kruidvat grew from 85.94 to 133.73 in Visibility Index, a +55.6 percent increase. This growth reflects strong category coverage, improved internal linking between product and category pages, and clear alignment with high-intent transactional searches. Kruidvat’s SEO performance shows how well-structured retail sites can still gain ground by scaling useful, purchase-oriented content rather than relying purely on brand demand.
Kruidvat's strong SEO year through SISTRIX visibility index
H&M SEO performance in 2025
H&M increased its visibility from 56.66 to 84.35, resulting in +48.9 percent growth. The gains point to stronger visibility of category and product pages, supported by consistent international templates and broad coverage of fashion-related searches. This suggests continued optimisation of indexable collections and better capture of non-brand, discovery-driven queries.
Colruyt SEO performance in 2025
Colruyt grew from 168.02 to 242.67, an increase of +44.4 percent, driven primarily by grocery-related searches. Food and supermarket SEO benefits heavily from recurring, high-frequency queries, and Colruyt’s growth indicates strong performance across categories, availability-driven pages, and informational content related to everyday products.
Brico SEO performance in 2025
Brico rose from 139.68 to 200.60, delivering +43.6 percent growth in DIY and home improvement searches. This category performs well when informational content and transactional pages reinforce each other, and Brico’s gains suggest effective coverage of how-to queries, project-related searches, and supporting product pages.
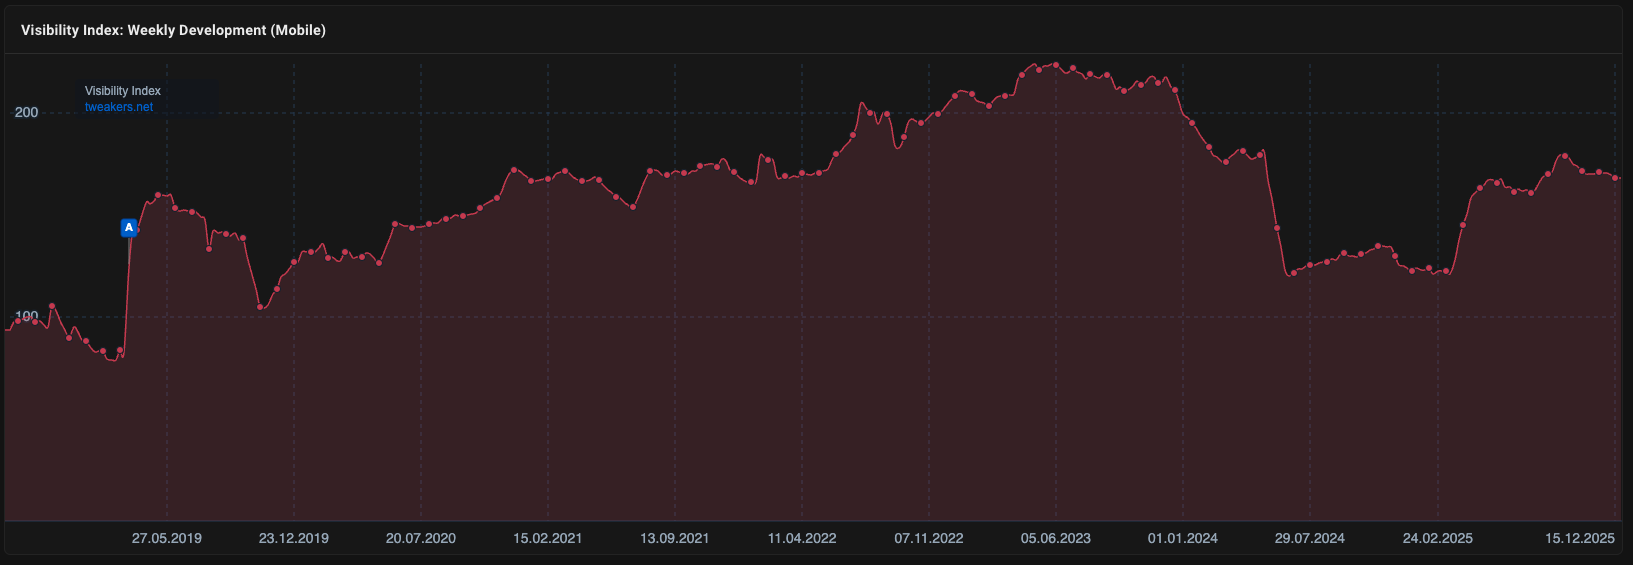
Tweakers SEO performance in 2025
Tweakers increased its visibility from 123.60 to 168.28, a +36.1 percent gain, reinforcing its authority in technology-related searches. The platform benefits from in-depth reviews, comparisons, and continuously updated content, which aligns closely with Google’s preference for expert-driven and experience-based information in complex product categories.
Decathlon SEO performance in 2025
Decathlon grew from 145.69 to 196.35, achieving +34.8 percent growth through broad category coverage. The brand’s ability to rank across multiple sports, product types, and informational queries highlights the strength of a scalable category structure combined with clear intent matching.
Mijnwoordenboek SEO performance in 2025
Mijnwoordenboek increased from 212.22 to 284.54, a +34.1 percent rise driven by long-tail informational searches. Unlike some dictionary-style sites that lost visibility, Mijnwoordenboek appears to have benefited from breadth of coverage and continued relevance for niche and specific language queries.
YouTube SEO performance in 2025
YouTube grew from 525.79 to 696.36, resulting in +32.4 percent growth due to increased visibility in blended search results. As video continues to be integrated into more informational and instructional SERPs, YouTube benefits structurally from its ability to satisfy complex queries with rich, multimedia content.
Netflix SEO performance in 2025
Netflix increased from 77.20 to 102.07, a +32.2 percent gain supported by strong entertainment-related search demand. Growth is largely driven by title-based searches, release-related queries, and discovery searches around series and films, reinforcing how branded content ecosystems can still grow organically alongside informational platforms.
Belgium • Sistrix Visibility
Top 10 SEO winners in Belgium in 2025
Ranked by percentage growth between Jan 6, 2025 and Dec 15, 2025. Values show start and end Visibility Index.
6th Man comparison
Domain
Visibility 1
Visibility 2
Percentual change
What caused it / short explanation
1. reddit.com
173.29
391.71
+126.0%
Google favored discussion and UGC on informational queries.
2. kruidvat.be
85.94
133.73
+55.6%
Retail category growth and stronger coverage.
3. hm.com
56.66
84.35
+48.9%
Improved category and product visibility.
4. colruyt.be
168.02
242.67
+44.4%
Gains on grocery related searches.
5. brico.be
139.68
200.60
+43.6%
DIY and home improvement demand.
6. tweakers.net
123.60
168.28
+36.1%
Reinforced authority in tech searches.
7. decathlon.be
145.69
196.35
+34.8%
Broad category coverage across sports goods.
8. mijnwoordenboek.nl
212.22
284.54
+34.1%
Long tail informational queries.
9. youtube.com
525.79
696.36
+32.4%
Higher presence in blended SERPs.
10. netflix.com
77.20
102.07
+32.2%
Demand for entertainment related queries.
Top 10 SEO losers in Belgium in 2025
The losers below are ranked by percentage decline in Visibility Index over the same period.
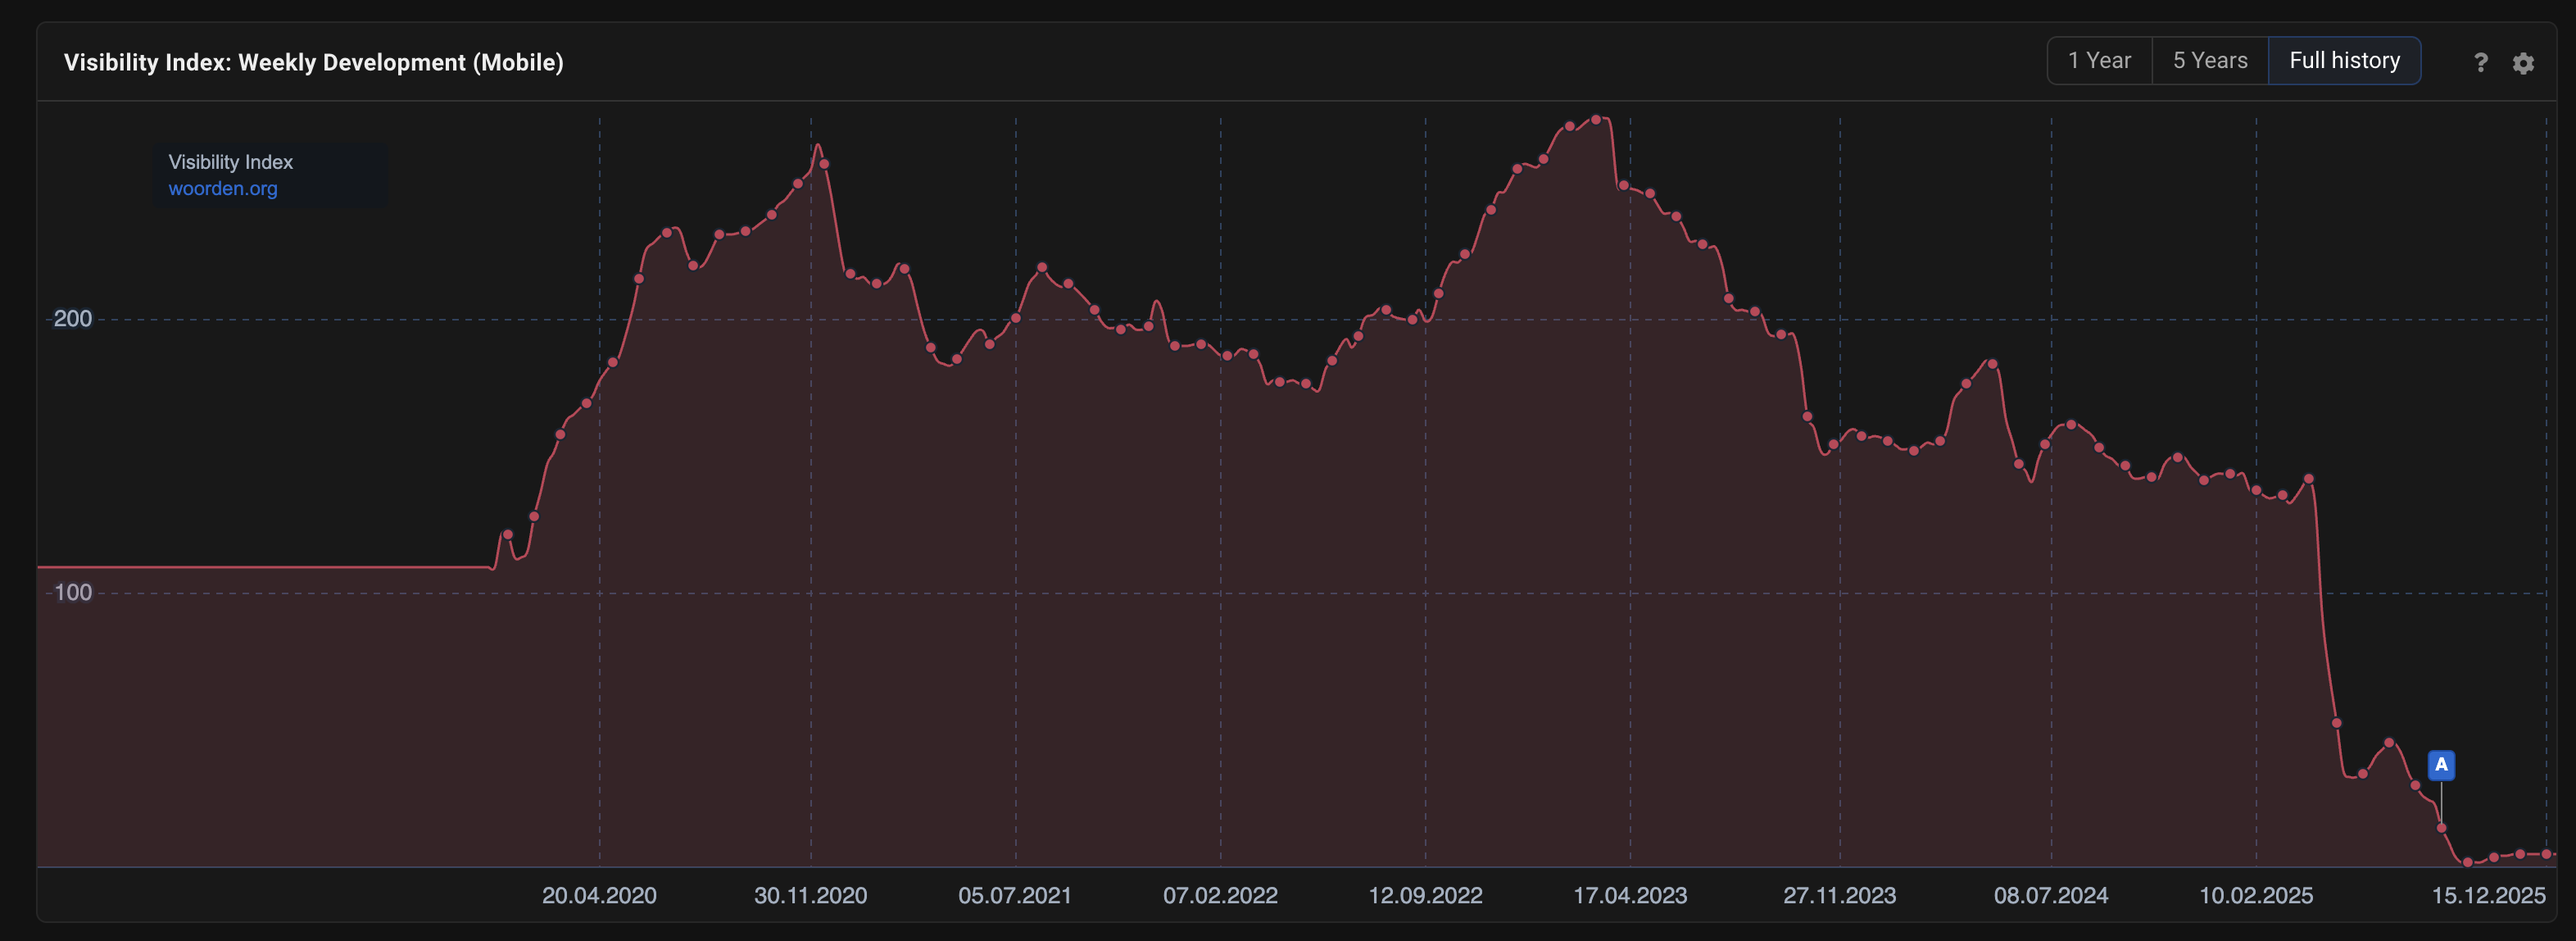
Woorden SEO performance in 2025
Steepest visibility collapse
Woorden collapsed from 144.17 to 4.94 in Visibility Index, a -96.6 percent decline, indicating near total loss of organic visibility. This type of drop typically points to a combination of algorithmic devaluation and structural weaknesses. Dictionary-style reference sites with limited original context or differentiation were hit hard in 2025, as Google continued to reduce exposure for redundant informational content that adds little beyond definitions.
The spectacular collapse of Woorden.org in SEO.
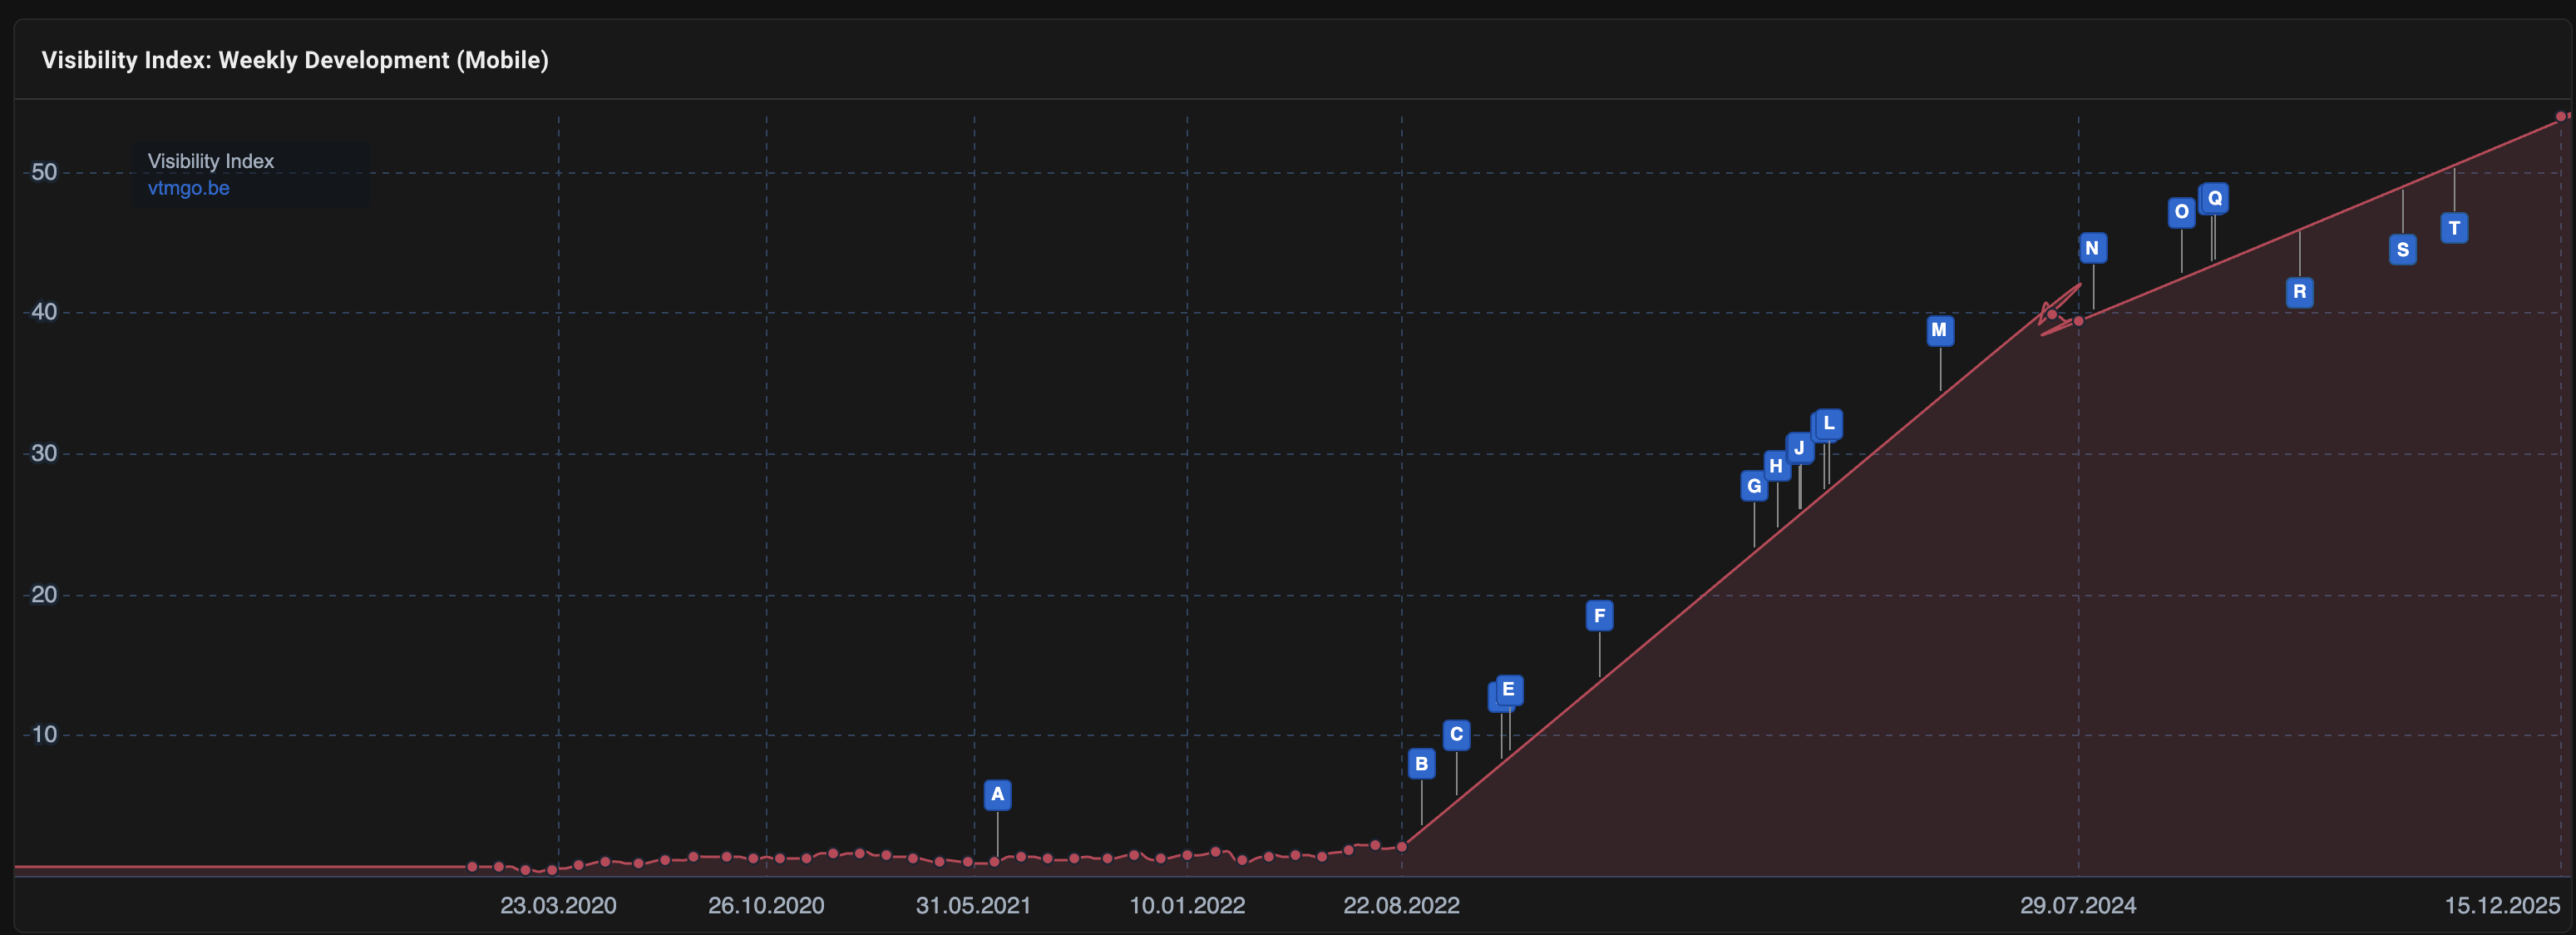
VTM SEO performance in 2025 (move to vtmgo.be
VTM dropped from 94.21 to 30.95, losing -67.1 percent of its visibility. Such a steep decline often suggests major structural changes, reduced indexation, or shifts in editorial strategy. For VTM, a switch to vtmgo.be for their videocontent had the biggest impact. Judging this brands performance, we should take this into consideration. (Thank you for the input on this Mathias from Depends SEO)
Growth of VTM's new video domain (vtmgo.be) in the past years according to SISTRIX visibility index.
Wiktionary SEO performance in 2025
Wiktionary declined from 297.65 to 103.96, a -65.1 percent loss. Similar to other dictionary and reference platforms, Wiktionary appears to have suffered from Google’s increased selectivity around definition-based content, where only a limited number of sources are consistently rewarded for generic lookup queries.
Albert Heijn SEO performance in 2025
Albert Heijn fell from 196.52 to 95.27, a -51.5 percent drop in visibility. While the brand remains strong, the decline suggests growing competition in grocery-related searches and possible shifts in how Google evaluates large supermarket sites, particularly around product availability, filtering, and category page indexation.
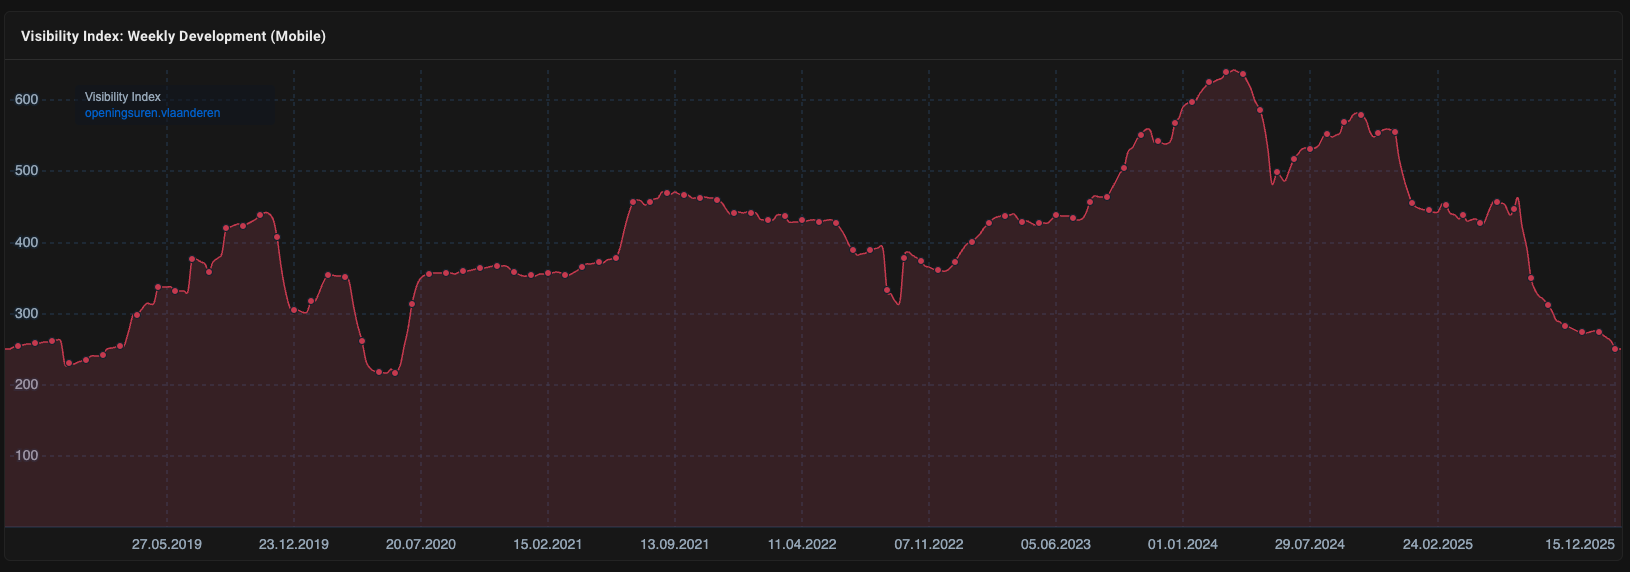
Openingsuren Vlaanderen SEO performance in 2025
Openingsuren Vlaanderen declined from 470.94 to 250.62, a -46.8 percent decrease. Sites focused on opening hours and basic business information face increasing pressure as Google surfaces more of this data directly in SERP features, reducing the need to click through to third-party directories. Openingsuren Vlaanderen focusses on opening hours, which Google also offers through the Google My Business feature.
The website got a hit after Google's update in december and july.
Gocar SEO performance in 2025
Gocar dropped from 50.80 to 28.47, losing -44.0 percent of its visibility. Automotive marketplaces often depend on large volumes of similar listing pages, which makes them sensitive to changes in duplication handling, crawl prioritisation, and overall content quality evaluation.
Libelle SEO performance in 2025
Libelle declined from 98.32 to 58.95, a -40.0 percent drop. Lifestyle and magazine-style publishers faced a tougher SEO environment in 2025, especially where content overlaps heavily with competitors and lacks clear topical differentiation or depth.
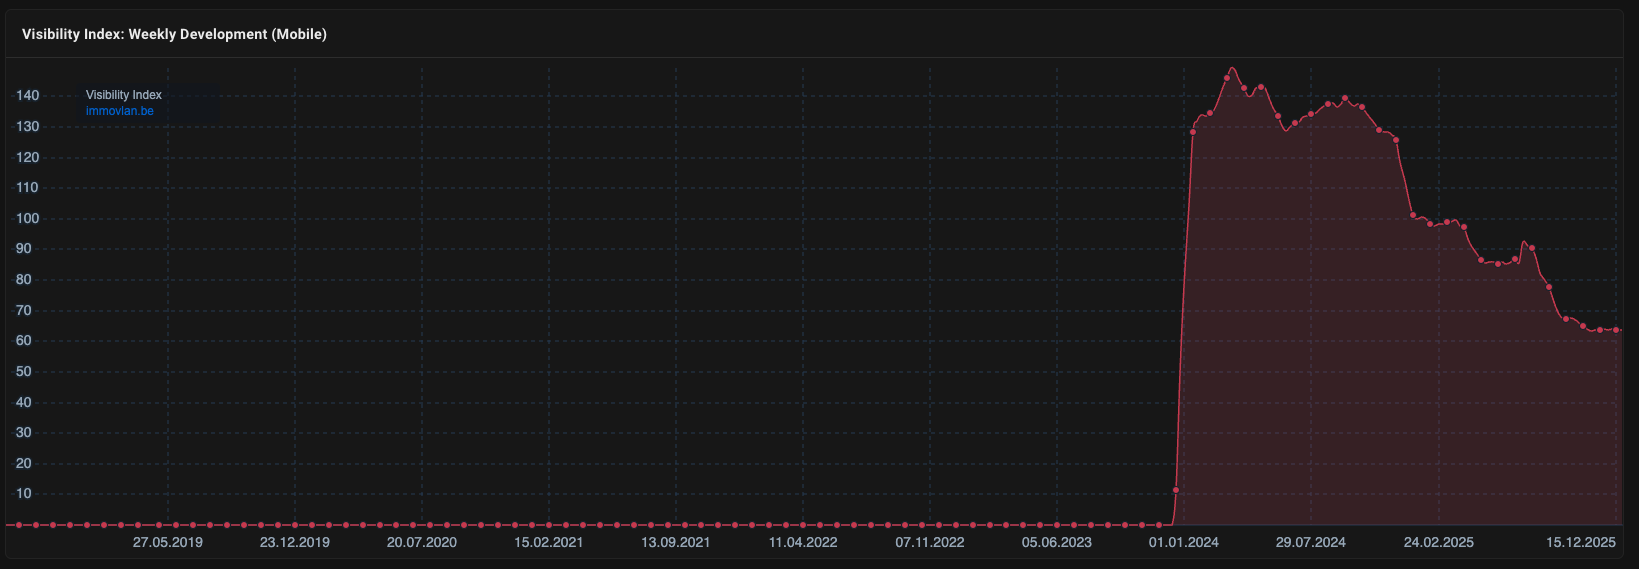
ImmoVlan SEO performance in 2025
ImmoVlan dropped from 106.14 to 63.79, losing -39.9 percent of its visibility. Real estate portals are increasingly competitive, and declines like this often reflect stronger performance by rivals, changes in indexation of listings, or reduced visibility for thin or repetitive property pages. In case of ImmoVlan, they saw a reduction in visibility since stepping into the Roularta Group. (Thank you for the input on this Mathias from Depends SEO)
Etsy SEO performance in 2025
Etsy declined from 53.76 to 32.69, a -39.2 percent loss. As a global marketplace, Etsy faces constant pressure from both specialised e-commerce sites and other large platforms, and its drop suggests shifting visibility in product and category level searches rather than a collapse of brand demand. One of the reasons for the decline could be the growing disatisfaction of the sellers on the platform. Both our sources on Facebook and Reddit show this is a growing issue for the marketplace.
X SEO performance in 2025
X fell from 102.80 to 63.33, a -38.4 percent decline. The decrease reflects reduced organic visibility of public posts and profiles, likely driven by changes in content accessibility, indexing signals, and Google’s evolving stance on social content as a primary answer source. A lot of brands pulled their advertising budgets when Muisk acquired X. Also, the controversial rebranding from Twitter to X caused a drop in usage.
Belgium • Sistrix Visibility
Top 10 SEO losers in Belgium in 2025
Ranked by percentage decline from Jan 6, 2025 to Dec 15, 2025. Values show start and end Visibility Index.
6th Man comparison
Domain
Visibility 1
Visibility 2
Percentual change
What caused it / short explanation
1. woorden.org
144.17
4.94
-96.6%
Dictionary style pages hit by Google quality changes; limited original context.
2. vtm.be
94.21
30.95
-67.1%
Likely structural or editorial shifts reduced visibility.
3. wiktionary.org
297.65
103.96
-65.1%
Shifting evaluation of dictionary style content.
4. ah.be
196.52
95.27
-51.5%
Retail visibility weakened across key categories.
5. openingsuren.vlaanderen
470.94
250.62
-46.8%
Rising competition in local listings and directory queries.
6. gocar.be
50.80
28.47
-44.0%
Visibility contraction in automotive searches.
7. libelle.be
98.32
58.95
-40.0%
Lifestyle content lost share to stronger competitors.
8. immovlan.be
106.14
63.79
-39.9%
Real estate queries softened; competitive pressure increased.
9. etsy.com
53.76
32.69
-39.2%
Marketplace visibility fell across categories.
10. x.com
102.80
63.33
-38.4%
Lower visibility for social result types.
Top 10 biggest domains by visibility at the end of 2025
These domains are ranked by absolute SISTRIX Visibility Index on December 15, 2025. It's a combination of social media (Meta and Google), local media and e-comm marketplaces.
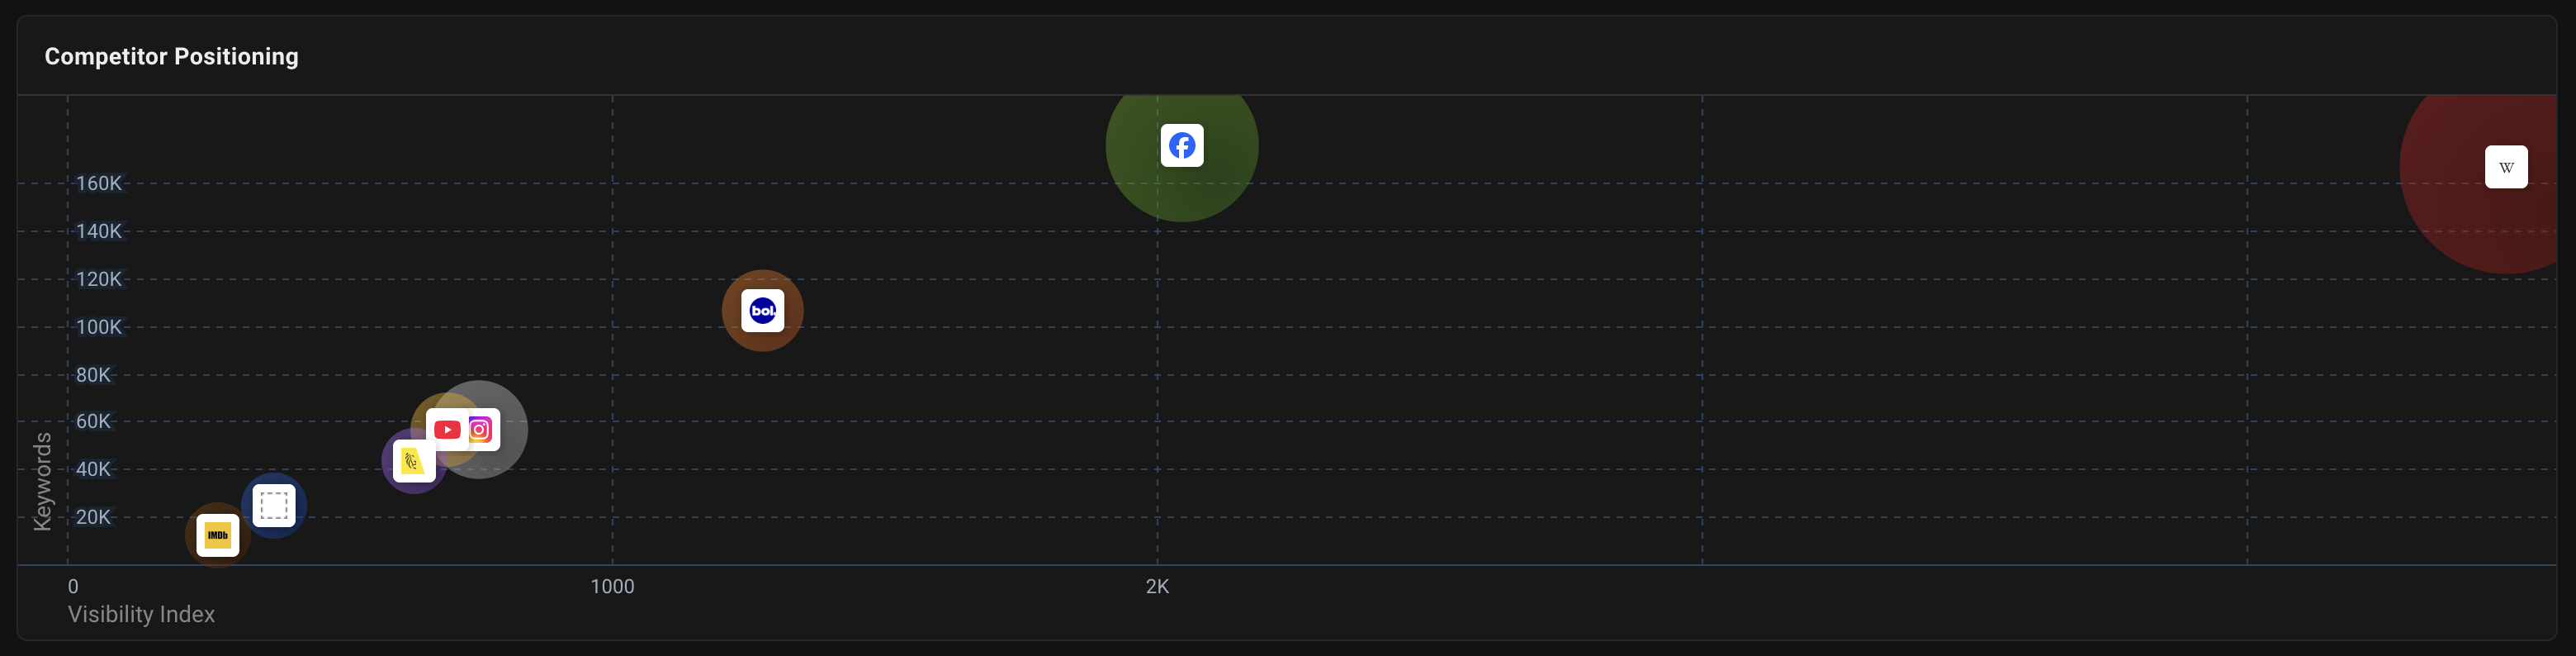
Wikipedia SEO performance in 2025
Most dominant domain in Belgian search
Wikipedia ended 2025 with a Visibility Index of 4476.70, up slightly from 4377.21, maintaining its role as the dominant reference source in informational searches.
Wikipedia compared to its competitors in the SERP. Not a single domain comes even close to its strength.
Facebook SEO performance in 2025
Facebook closed the year with 2045.80 visibility, growing +9.8 percent year over year. Despite being a social platform rather than a traditional publisher, Facebook continues to capture organic visibility through public pages, groups, and branded profile content that surfaces for navigational and discovery driven searches. Its growth reflects Google’s continued willingness to rank large platforms when they satisfy intent at scale.
Bol SEO performance in 2025
Bol ended the year at 1277.02 visibility, despite a -9.5 percent decline compared to January. While Bol remains one of the most dominant e-commerce domains in Belgium, the dip suggests increased competition in product and category searches, as well as possible shifts in how Google evaluates large marketplace templates versus more focused retail sites.
Instagram SEO performance in 2025
Instagram closed 2025 at 754.41 visibility, reflecting +16.4 percent growth. This increase is closely tied to Google’s expanding use of visual and short-form content in search results, where public profiles, reels, and image driven pages increasingly appear for discovery and brand related queries.
YouTube SEO performance in 2025
YouTube finished the year with 696.36 visibility, marking one of the strongest absolute gains of 2025. As Google continues to blend video results into informational and how-to searches, YouTube benefits structurally from its tight integration with Google Search and its ability to satisfy complex queries through long-form and tutorial based content.
Vlaanderen SEO performance in 2025
Vlaanderen ended 2025 at 636.02 visibility, showing relatively stable performance throughout the year. As an official government domain, Vlaanderen benefits from high trust, strong authority signals, and consistent informational intent, which tend to insulate it from extreme algorithmic volatility.
VRT SEO performance in 2025
VRT closed the year at 594.79 visibility, up +6.2 percent year over year. The moderate growth suggests steady performance across news and broadcast related queries, supported by topical authority and strong brand recognition, even as competition in media SERPs remains intense. Surpringly, VRT's sport news website (Sporza), is at Belgiums 50th place, growing 8% in visibility in 2025.
2dehands SEO performance in 2025
2dehands reached 560.74 visibility, maintaining strong marketplace dominance. Classified and marketplace platforms continue to perform well in organic search due to their ability to cover a wide range of long-tail transactional queries at scale.
HLN SEO performance in 2025
HLN ended 2025 at 531.77 visibility, reflecting +7.0 percent growth. The increase points to consistent visibility across breaking news, evergreen explainers, and branded searches, showing that established news publishers can still grow when editorial structure and topical coverage remain strong.
Google SEO performance in 2025
Google rounds out the top ten with 424.33 visibility in Belgium. While Google is not a traditional destination site, its presence in the visibility index reflects the ranking of its own properties and informational assets, reinforcing how vertically integrated Google’s ecosystem has become within its own search results.
Top 10 domains
Visibility Index leaders (Dec 15, 2025)
Bars are scaled relative to the top domain (wikipedia.org = 4476.70).
6th Man table
Domain
Visibility Index
Note
1. wikipedia.org
Index
4476.70
Most dominant domain; up from 4377.21.
2. facebook.com
Index
2045.80
+9.8% year over year.
3. bol.com
Index
1277.02
-9.5% versus January.
4. instagram.com
Index
754.41
+16.4% growth.
5. youtube.com
Index
696.36
One of the strongest absolute gains.
6. vlaanderen.be
Index
636.02
Relatively stable performance.
7. vrt.be
Index
594.79
+6.2% year over year.
8. 2dehands.be
Index
560.74
Maintained marketplace dominance.
9. hln.be
Index
531.77
+7.0% growth.
10. google.com
Index
424.33
Rounds out the top ten.
Top marketplaces in Belgium by organic visibility in 2025
Below is an overview of how major marketplace and platform-style advertisers evolved in organic search visibility in Belgium throughout 2025. The comparison is based on changes in summed ranking positions between January and December, where a lower total position indicates stronger overall visibility.
Belgium • 2025
Top marketplaces by organic visibility
Lower sums indicate higher visibility. December shows the value and the change vs January.
6th Man comparison
Domain
January sum of positions
December sum of positions (Δ vs Jan)
bol.com
3
3 (Δ 0)
2dehands.be
8
9 (Δ -1)
booking.com
15
17 (Δ -2)
autoscout24.be
24
20 (Δ 4)
zimmo.be
21
33 (Δ -12)
marktplaats.nl
48
54 (Δ -6)
indeed.com
44
60 (Δ -16)
takeaway.com
106
102 (Δ 4)
jobat.be
120
109 (Δ 11)
realo.be
124
116 (Δ 8)
autogids.be
99
122 (Δ -23)
immovlan.be
79
135 (Δ -56)
amazon.com.be
129
142 (Δ -13)
skyscanner.net
138
145 (Δ -7)
immoscoop.be
162
147 (Δ 15)
etsy.com
159
164 (Δ -5)
Total
1279
1378 (Δ -99)
bol.com
Bol.com remained the most dominant marketplace in Belgian search in 2025. Its summed position stayed stable at 3 throughout the year, indicating consistent top rankings across a wide range of high-intent queries. This stability highlights bol.com’s strong category architecture, brand demand, and resilience against competitive pressure and algorithm shifts.
Bol.com homepage on December 17th 2025.
2dehands.be
2dehands saw a slight decline, moving from a summed position of 8 to 9. While still one of the strongest marketplaces in Belgium, the small drop suggests increasing competition in long-tail transactional and classified searches, rather than a structural SEO issue. With around 70.000 new listings per day, 2dehands owns the Belgian second-hand marketplace.
booking.com
Booking.com declined modestly from position 15 to 17. The platform remains highly visible, but the drop reflects growing competition from other travel platforms and Google’s own travel-related SERP features, which continue to absorb more user attention.
autoscout24.be
Autoscout24 improved its visibility, moving from position 24 to 20. This gain suggests stronger performance in automotive searches, likely driven by improved category depth, better coverage of model-specific queries, or stronger alignment with buyer intent.
zimmo.be
Zimmo experienced a notable decline, dropping from position 21 to 33. This indicates reduced visibility in real estate searches, a highly competitive space where portals are sensitive to duplication, filtering strategies, and listing quality signals.
marktplaats.nl
Marktplaats declined slightly from position 48 to 54. As a cross-border marketplace, its Belgian visibility appears to have weakened marginally, potentially due to stronger local competitors or reduced relevance for Belgium-specific queries.
indeed.com
Indeed saw a significant decline from position 44 to 60. Job platforms are increasingly affected by Google Jobs integrations and SERP features, which can displace organic listings even when content quality remains strong.
takeaway.com
Takeaway improved its summed position from 106 to 102. While still outside the top tier, this growth suggests incremental gains in local and branded food delivery searches, despite heavy competition and SERP crowding.
jobat.be
Jobat showed a clear improvement, moving from position 120 to 109. This gain indicates stronger performance in niche or local employment searches, possibly driven by better targeting or improved content relevance.
realo.be
Realo improved from position 124 to 116. Although still relatively small in absolute visibility, the positive movement suggests growing traction in real estate-related informational or valuation queries.
autogids.be
Autogids suffered a sharp decline, dropping from position 99 to 122. Automotive content sites without a marketplace or listing-driven model appear more vulnerable to volatility, especially when competing with platforms and large publishers.
immovlan.be
Immovlan recorded one of the steepest declines, falling from position 79 to 135. This drop reflects intense competition in property portals and suggests challenges around differentiation, indexation of listings, or overall relevance signals. Immovlans drop could be caused by it's sale by media company Roularta to Rossel in april 2025.
The rise and crash of Immovlan in the Search Engines.
amazon.com.be
Amazon Belgium declined from position 129 to 142. While Amazon remains a global e-commerce powerhouse, its Belgian domain still faces challenges competing with entrenched local marketplaces and category-specific leaders.
skyscanner.net
Skyscanner declined slightly from position 138 to 145. As with other travel aggregators, visibility pressure from Google’s own flight and travel features likely played a role in this gradual erosion.
immoscoop.be
Immoscoop showed strong improvement, moving from position 162 to 147. This suggests growing visibility in property searches, potentially driven by better coverage of long-tail listings or improved technical foundations.
etsy.com
Etsy declined marginally from position 159 to 164. The platform remains visible for niche and handmade product searches, but competition from specialised e-commerce sites and larger marketplaces continues to limit growth.
Across marketplaces, 2025 showed a net decline in summed positions, indicating tougher competition and more fragmented visibility. Platforms with strong brand demand and scalable category structures held ground, while real estate, jobs, and travel marketplaces faced increasing pressure from both competitors and Google’s own SERP features.
Top Directories in Belgium in 2025 in terms of SEO
Directories
Ranking position changes
Comparison of January versus December positions across directory domains.
6th Man comparison
Domain
January to December
Position change
openingsuren.vlaanderen
11 to 26
-15
companyweb.be
37 to 34
+3
goudengids.be
53 to 45
+8
trustpilot.com
32 to 46
-14
openingsurengids.be
51 to 56
-5
handelsgids.be
49 to 57
-8
openingsuren.com
109 to 114
-5
trustlocal.be
147 to 160
-13
Eindtotaal
489 to 538
-49
Top 10 gambling and casino websites in Belgium in 2025
Visibility of the top gambling and casino websites in Belgium, according to SISTRIX data.
With gambling advertising banned in Belgium, organic search has become one of the few scalable acquisition channels left for betting and casino operators. At the same time, gambling SEO is one of the most aggressive verticals online, with a long history of black hat tactics, churn-and-burn domains, and constant algorithm pressure. The visibility data below shows a clear split between state-backed operators, licensed bookmakers, and sports data platforms that dominate informational intent.
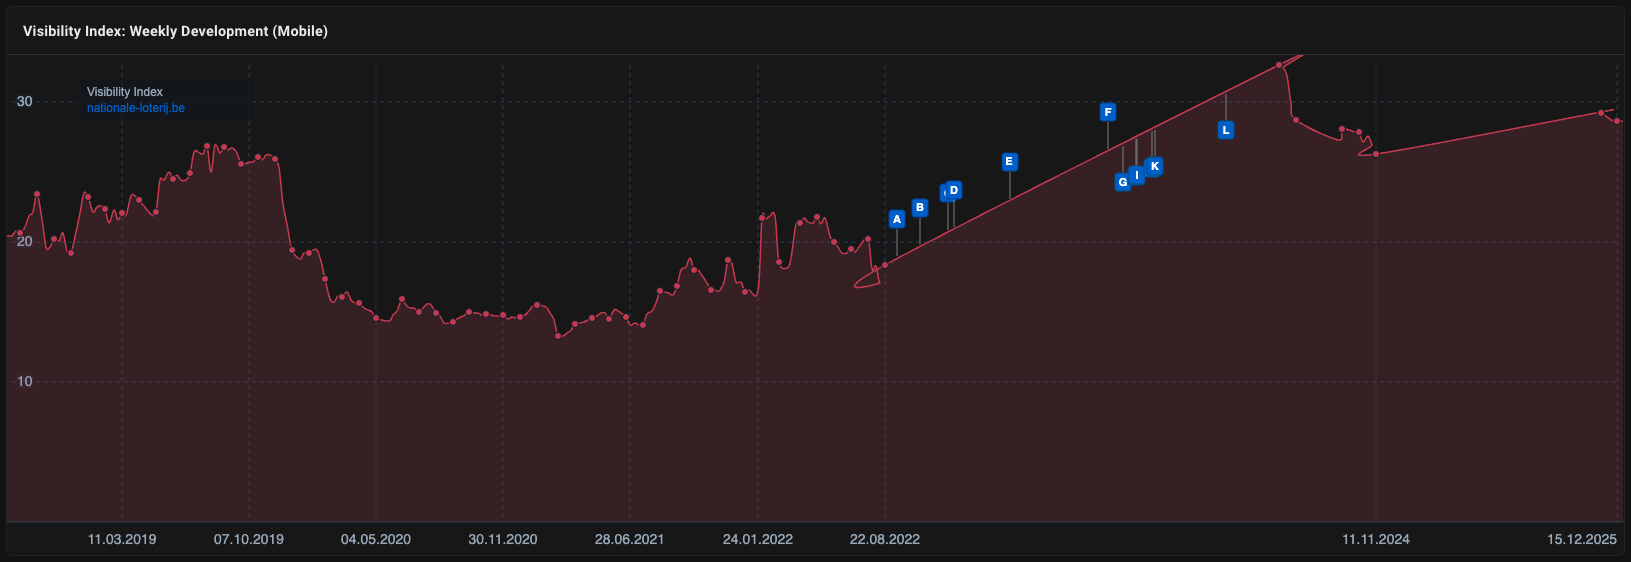
Nationale Loterij
Nationale Loterij is by far the most visible gambling-related domain in Belgium, with a Visibility Index of 29.38. Its dominance is driven by institutional trust, strong brand demand, and extensive informational coverage around lotteries and regulated games. These authority signals give Nationale Loterij a structural SEO advantage that private operators cannot easily replicate.
Visibility of the National Lottery in SERPs in the past years, according to SISTRIX visibility index.
Scooore.be
Scooore.be is the sports betting subdivision of Nationale Loterij and holds a Visibility Index of 1.38. Despite being backed by the most authoritative gambling brand in Belgium, Scooore’s visibility is relatively modest. This reflects a deliberate separation between lottery content and sports betting, likely driven by regulatory compliance and brand safety considerations. From an SEO perspective, this split limits authority transfer, but also protects the core Nationale Loterij domain from the volatility and scrutiny that often affect sports gambling pages and it's legal implications.
Flashscore (flashscore.nl and flashscore.com)
Flashscore remains the most visible non-gambling operator in the dataset, with 38.4 visibility for the .nl domain and 5.32 for the .com version. While not a bookmaker, Flashscore dominates search demand around live scores, fixtures, and results, capturing traffic earlier in the user journey than betting sites can.
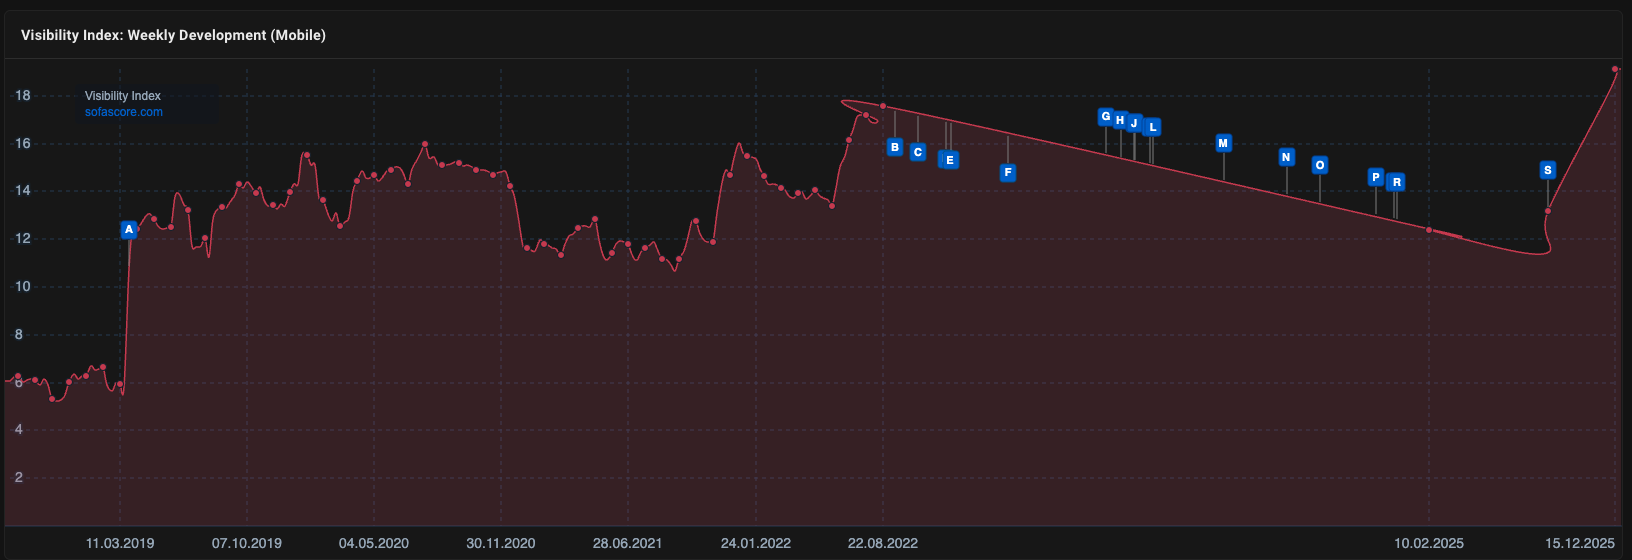
Sofascore
Sofascore holds a Visibility Index of 19.06, making it another dominant sports data platform. Its strength comes from real-time updates, deep internal linking per match and competition, and extremely strong engagement signals, all of which align well with Google’s preference for fresh, high-utility content.
Sofascore.com visibility in 2025 in Belgium, according to SISTRIX visbility index
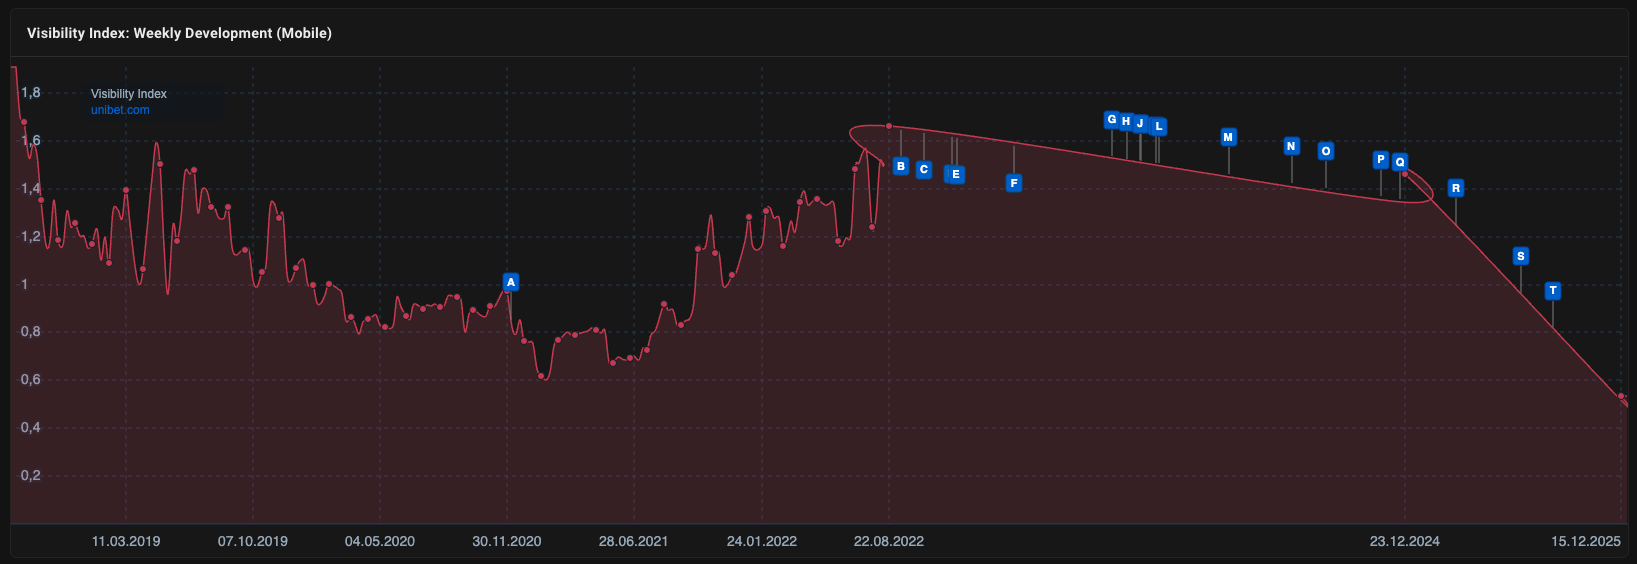
Unibet (unibetsports.be and unibet.nl)
Unibet shows limited visibility in Belgium, with 2.84 for unibetsports.be and 2.6 for unibet.nl. Despite strong brand awareness, SEO growth is constrained by regulatory limits, domain fragmentation, and increased scrutiny of gambling-related content.
Unibet took a big loss in terms of visibility in the last year.
Betfirst, Bwin, Ladbrokes, Bet777, TOTO
Most licensed bookmakers cluster between 1.5 and 2.5 in Visibility Index:
Betfirst: 2.34
Bwin: 2.32
Ladbrokes: 1.82
Bet777: 1.57
TOTO: 1.75
This tight clustering illustrates how limited the SEO ceiling is for transactional betting sites in Belgium, even for well-known brands.
Golden Palace (goldenpalace.be and goldenpalacesports.be)
Golden Palace shows split visibility between 2.03 (casino) and 0.40 (sports). This highlights how dividing authority across multiple gambling domains can dilute overall SEO performance in an already restricted market.
Smaller Belgian and affiliate-driven sites
Domains such as napoleonsports.be (0.71), pronoweb.be (0.56), mybookmakers.be (0.31), and scooore.be (1.38) operate at low visibility levels. These sites are particularly vulnerable to algorithm updates and link devaluations, especially in a niche historically associated with aggressive SEO practices.
Key takeaway on gambling and casino SEO in Belgium
In Belgium, gambling SEO is not dominated by bookmakers, but by sports data and information platforms. Even state-backed operators like Nationale Loterij benefit most from informational and brand-driven visibility, while their sports betting subdivisions remain intentionally limited in reach. In a market where paid advertising is banned and black hat tactics are common, authority, compliance, and informational intent coverage are the only sustainable paths to long-term organic visibility.
Tech websites SEO visibility in Belgium in 2025
The tech sector shows a relatively stable SEO landscape in Belgium, with modest gains and losses rather than extreme volatility. Unlike other verticals, tech visibility is split between retailers, manufacturers, and information-heavy platforms, each responding differently to Google’s increasing use of AI Overviews and rich results.
SEO visibility snapshot
Tech domains: December vs January
Total position sums per domain with month-over-month change.
6th Man comparison
Domain
January total
December total
coolblue.be
23
22 (Δ +1)
microsoft.com
26
27 (Δ -1)
mediamarkt.be
42
37 (Δ +5)
apple.com
36
39 (Δ -3)
tweakers.net
64
43 (Δ +21)
vandenborre.be
95
87 (Δ +8)
krefel.be
97
92 (Δ +5)
samsung.com
112
118 (Δ -6)
amazon.nl
127
130 (Δ -3)
fnac.be
148
158 (Δ -10)
Eindtotaal
770
753 (Δ +17)
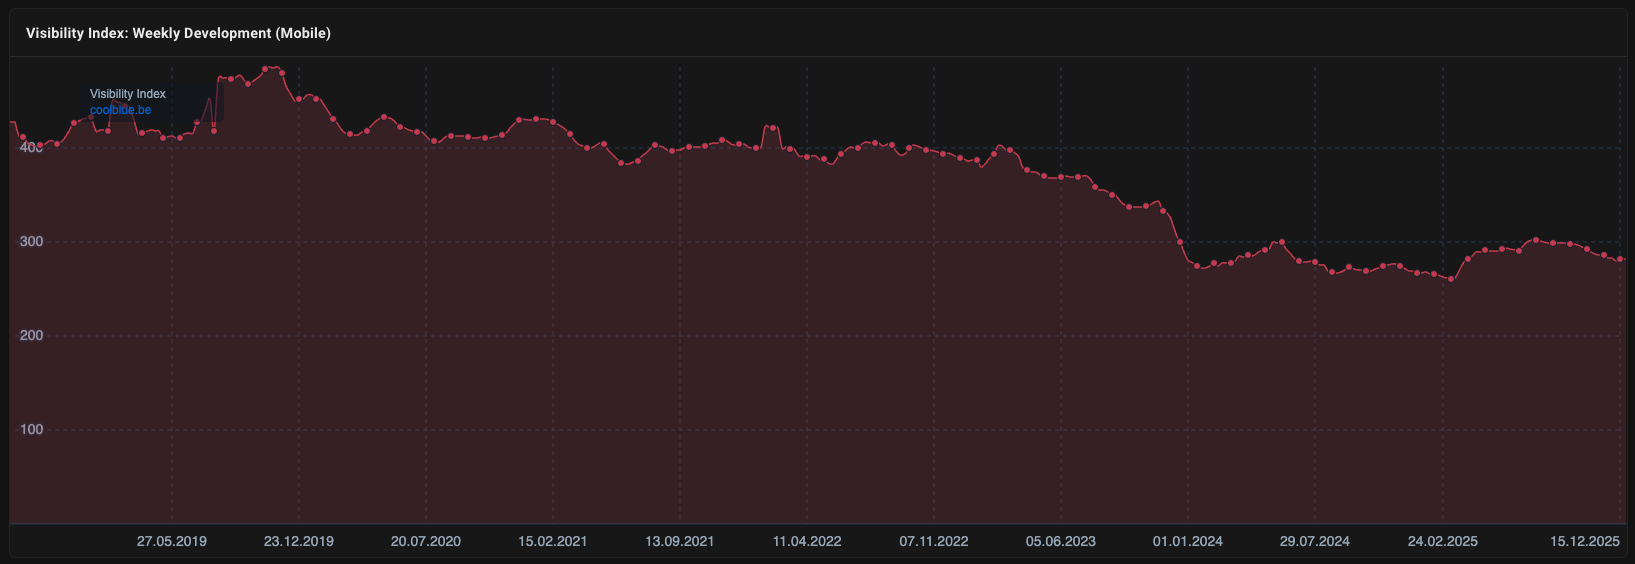
Coolblue SEO performance in 2025
Coolblue remained the strongest tech retailer in Belgian search, improving slightly from a summed position of 23 to 22. This stability reflects Coolblue’s strong brand demand, high-quality category pages, and extensive supporting content such as buying guides and FAQs that continue to rank well despite SERP crowding. Coolblue is known for it's extensive category pages and top notch customer support. Around 2018, Coolblue moved from it's separate, niche domains to one centralised domain (coolblue.nl)
Cooblue's soft decline in visibility throughout the years.
Microsoft
Microsoft saw a minor decline from position 26 to 27. As a global brand, Microsoft’s visibility is largely driven by navigational and product-related queries, which tend to remain stable year over year, even as competition and SERP features increase.
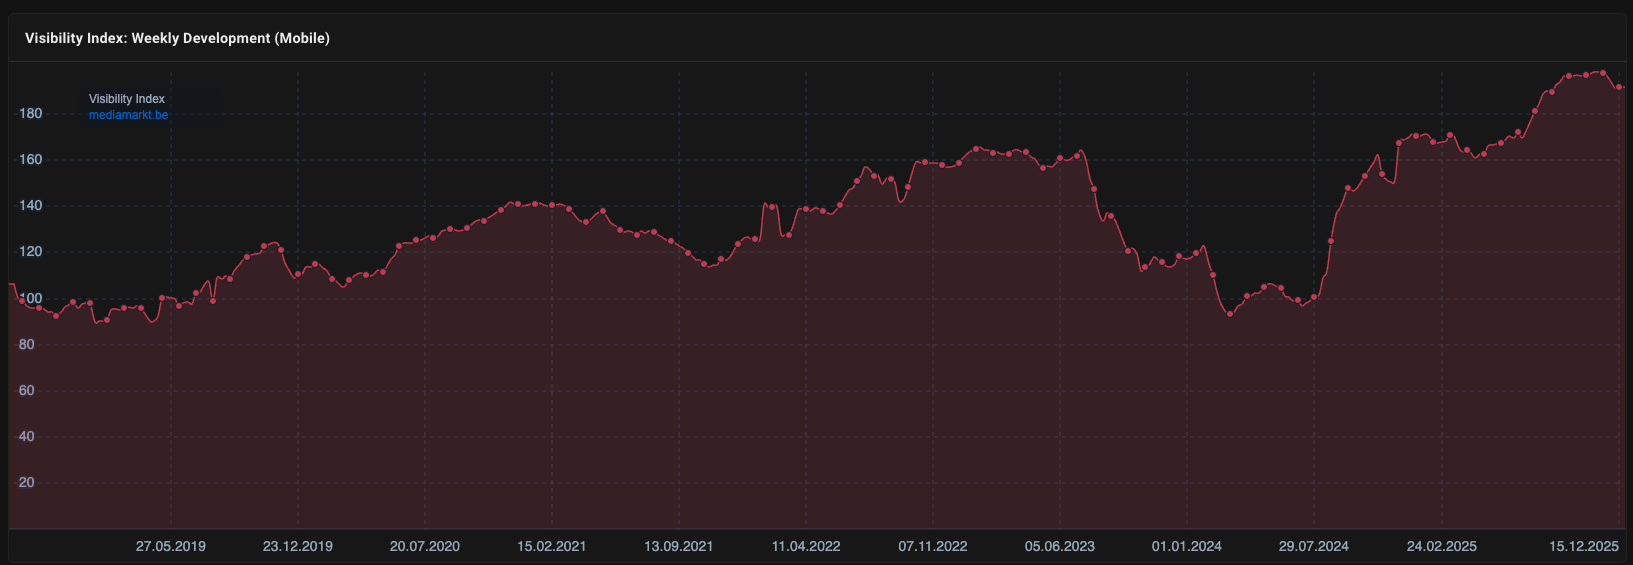
MediaMarkt
MediaMarkt improved from position 42 to 37, showing one of the stronger gains among tech retailers. This growth suggests better coverage of product categories and promotions, as well as improved alignment with high-intent transactional searches. Mediamarkt.be was translated into English, bringing a whole new range of keywords to their performance.
Apple SEO performance in 2025
Apple declined slightly from position 36 to 39. While Apple remains dominant for brand-driven searches, its SEO visibility is less focused on broad informational queries, making it more sensitive to shifts in how Google surfaces comparison and research content.
Tweakers SEO performance in 2025
Special case: information-first platform
Tweakers showed the strongest improvement in the sector, jumping from position 64 to 43. This is notable because much informational tech content was partially displaced by Google’s AI Overviews in 2025. Despite this, Tweakers maintained and even improved visibility thanks to deep expertise, original reviews, active community discussions, and continuously updated comparison data. This reinforces that high-quality, experience-driven content can still win visibility even as generic information is absorbed by AI features.
Tweakers.net doing a good job maintaining it's authority while Google implements the AI overview in the SERP.
Vanden Borre SEO performance in 2025
Vanden Borre improved from position 95 to 87. The gain points to steady improvements in category and product visibility, although competition from larger retailers and marketplaces continues to cap growth.
Krëfel SEO performance in 2025
Krëfel moved from position 97 to 92, showing moderate gains. Like other electronics retailers, its visibility growth is incremental and closely tied to category breadth and seasonal demand.
Samsung SEO performance in 2025
Samsung declined from position 112 to 118. As a manufacturer, Samsung’s SEO performance is heavily brand-led and less dependent on long-tail product discovery, making its visibility more stable but also limiting upside.
Amazon.nl SEO performance in 2025
Amazon.nl declined slightly from position 127 to 130. Despite Amazon’s global strength, its Dutch domain faces strong competition in Belgium from local retailers and does not dominate tech searches in the same way it does in other markets.
Fnac SEO performance in 2025
Fnac saw the largest decline in the tech sector, dropping from position 148 to 158. This suggests increasing pressure from more specialised retailers and platforms with stronger category focus and content depth.
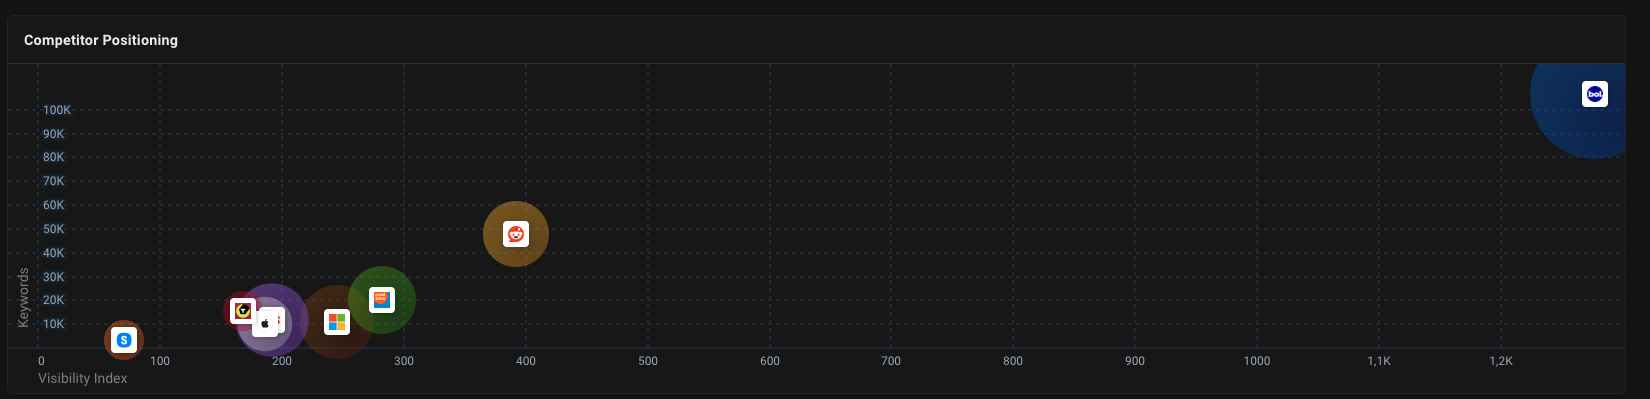
Key takeaway
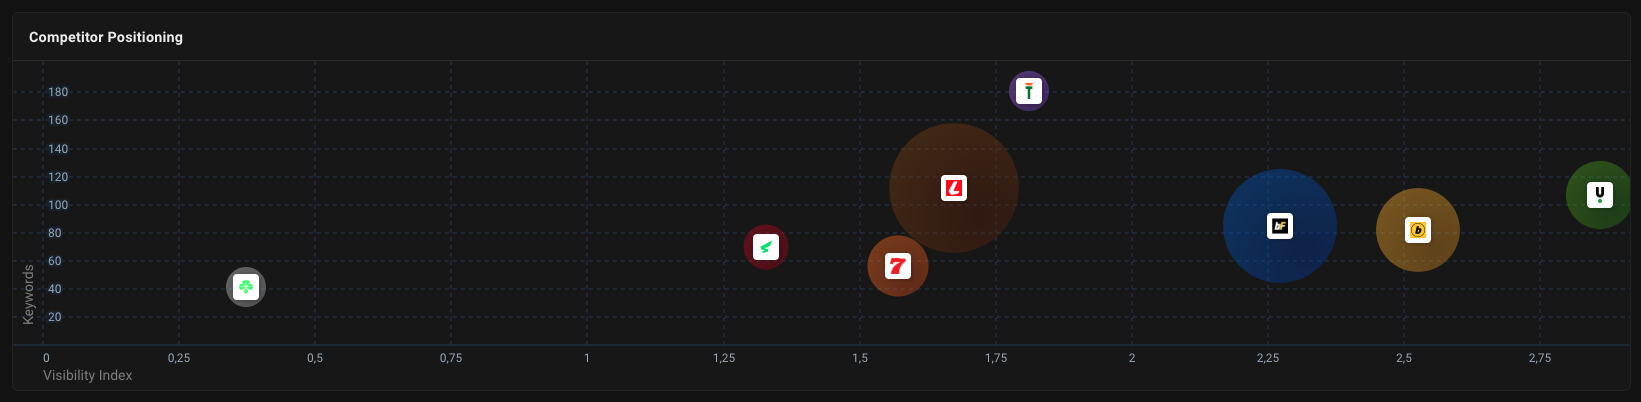
Competitove map of tech companies in Belgium
Tech SEO in Belgium in 2025 rewarded expertise, trust, and depth over generic informational content. Retailers with strong brands and well-structured categories held their ground, while information-first platforms like Tweakers proved that original, experience-based content can still thrive even as AI Overviews absorb large parts of the informational SERP.
The top travel websites in Belgium in 2025
Sector: Travel
Position changes and visibility (Jan vs Dec)
Bars are scaled relative to the highest Visibility Index in this list (tripadvisor.be = 936.823).
6th Man table
Domain
Position (Jan)
Position (Dec)
Change
Visibility Index (15.12.2025)
tripadvisor.be
4
4
0
Visibility
936.823
tui.be
46
41
+5
Visibility
178.767
vakantiediscounter.be
98
88
+10
Visibility
91.911
sunweb.be
115
112
+3
Visibility
74.445
trivago.be
122
113
+9
Visibility
74.121
expedia.be
145
124
+21
Visibility
69.236
neckermann.be
165
132
+33
Visibility
64.639
corendon.be
128
139
-11
Visibility
62.325
tui.nl
119
146
-27
Visibility
60.404
The travel sector shows clear redistribution of organic visibility in Belgium in 2025. While dominant platforms at the very top remained stable, mid-tier and challenger brands gained ground, often at the expense of international or cross-border domains. Travel SEO continues to be heavily influenced by brand demand, seasonal intent, and Google’s growing use of SERP features for destinations, hotels, and flights.
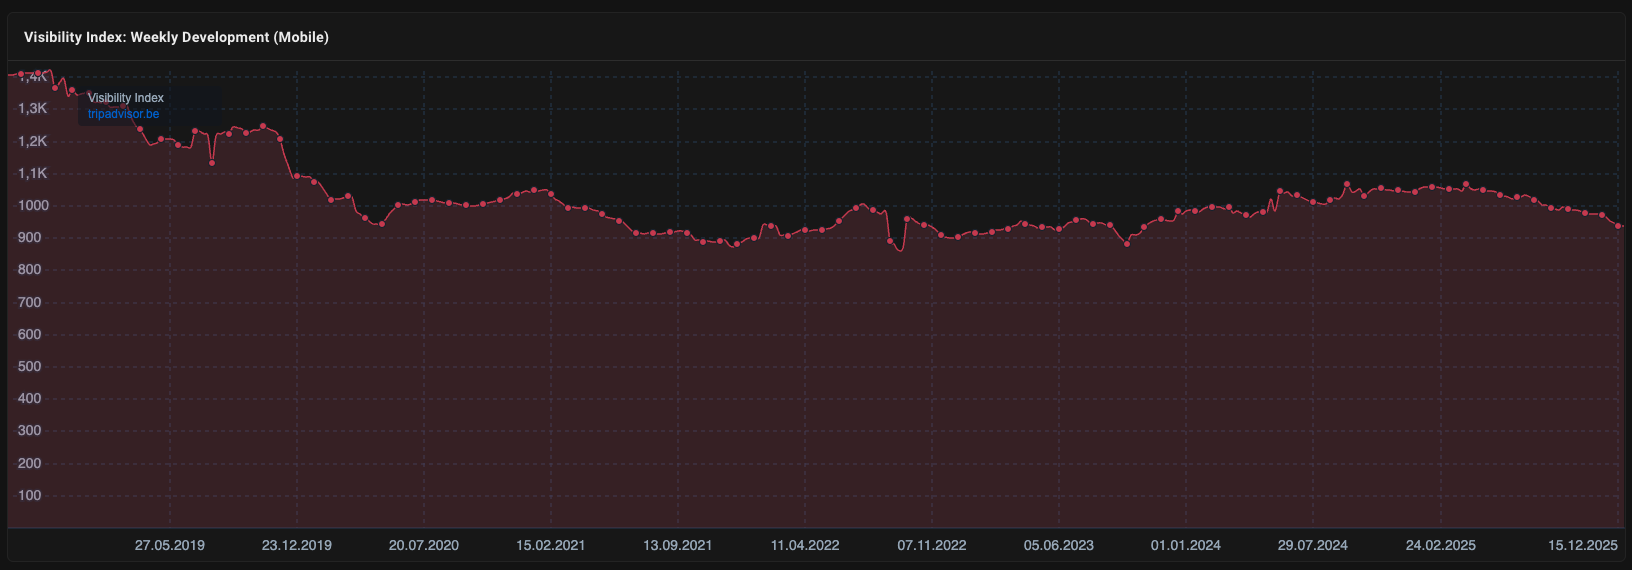
Tripadvisor SEO performance in 2025
Tripadvisor remained completely stable at the top, holding a summed position of 4 throughout the year. Despite pressure from Google’s own travel features and increasing competition, Tripadvisor continues to dominate travel-related informational and review queries, supported by strong brand recognition and massive content scale.
Tripadvisor's visibilty throughouttheyears, by SISTRIX visibility index.
TUI Belgium SEO performance in 2025
TUI.be improved from position 46 to 41. This gain reflects stronger visibility for destination, package holiday, and branded searches, suggesting improved alignment between commercial offerings and search intent within the Belgian market. TUI.nl saw a significant decline, dropping from position 119 to 146. This highlights a recurring pattern in Belgian search results, where local domains increasingly outperform cross-border alternatives due to stronger relevance and localisation signals.
Vakantiediscounter SEO performance in 2025
Vakantiediscounter made a solid gain, moving from position 98 to 88. The improvement indicates increased visibility for deal-driven and price-sensitive travel searches, a segment that remains highly competitive but rewarding during peak booking periods.
Sunweb SEO performance in 2025
Sunweb improved slightly from position 115 to 112. While the gain is modest, it suggests stable performance in a crowded travel SERP environment where even small improvements require significant optimisation.
Trivago SEO performance in 2025
Trivago moved from position 122 to 113, gaining visibility as a hotel comparison platform. This growth indicates continued relevance for comparison-based searches, even as Google surfaces more hotel data directly in search results.
Expedia SEO performance in 2025
Expedia showed one of the strongest improvements, jumping from position 145 to 124. This gain suggests renewed traction for its destination and accommodation pages, potentially supported by improved content depth or stronger internal linking.
Neckermann SEO performance in 2025
Neckermann recorded the largest gain in the travel sector, improving from position 165 to 132. This jump points to a strong recovery in organic visibility, likely driven by clearer positioning, improved destination coverage, or better targeting of long-tail travel queries.
Corendon SEO performance in 2025
Corendon declined from position 128 to 139, losing visibility over the year. This suggests increased competition in package holiday searches or weaker alignment with evolving user intent compared to faster-moving competitors.
Key takeaway
Travel SEO in Belgium in 2025 favoured local relevance and intent alignment. While dominant review platforms like Tripadvisor held their ground, growth was strongest among Belgian travel brands that improved destination coverage and pricing-driven content. Cross-border domains, even from strong brands, lost visibility as Google increasingly prioritised locally relevant results.
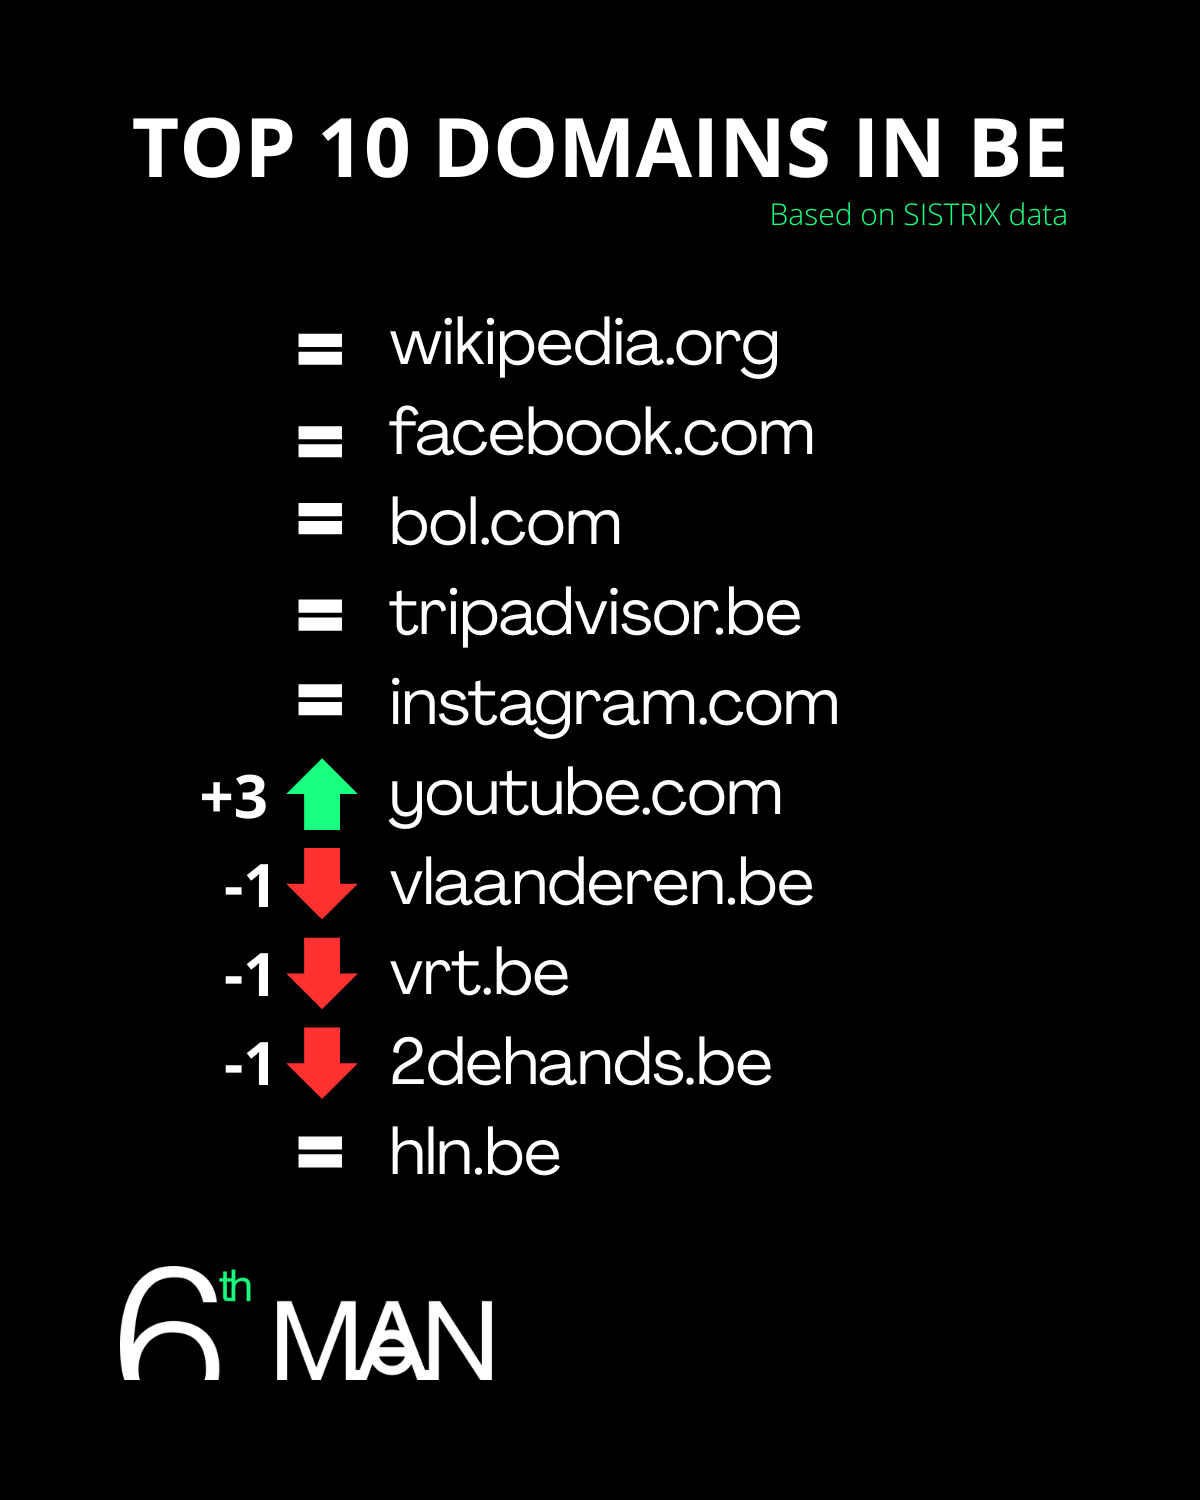
The top 10 domains in Belgium compared (2025)
There is movement in the Belgian top 10 domains.
Domains leaving the top 10:
None, but three domains lost a position and were aggressively overtaken by YouTube.
Domain entering the top 10:
None, but YouTube made a big jump in the top 10.
Overall top 150 domains insights
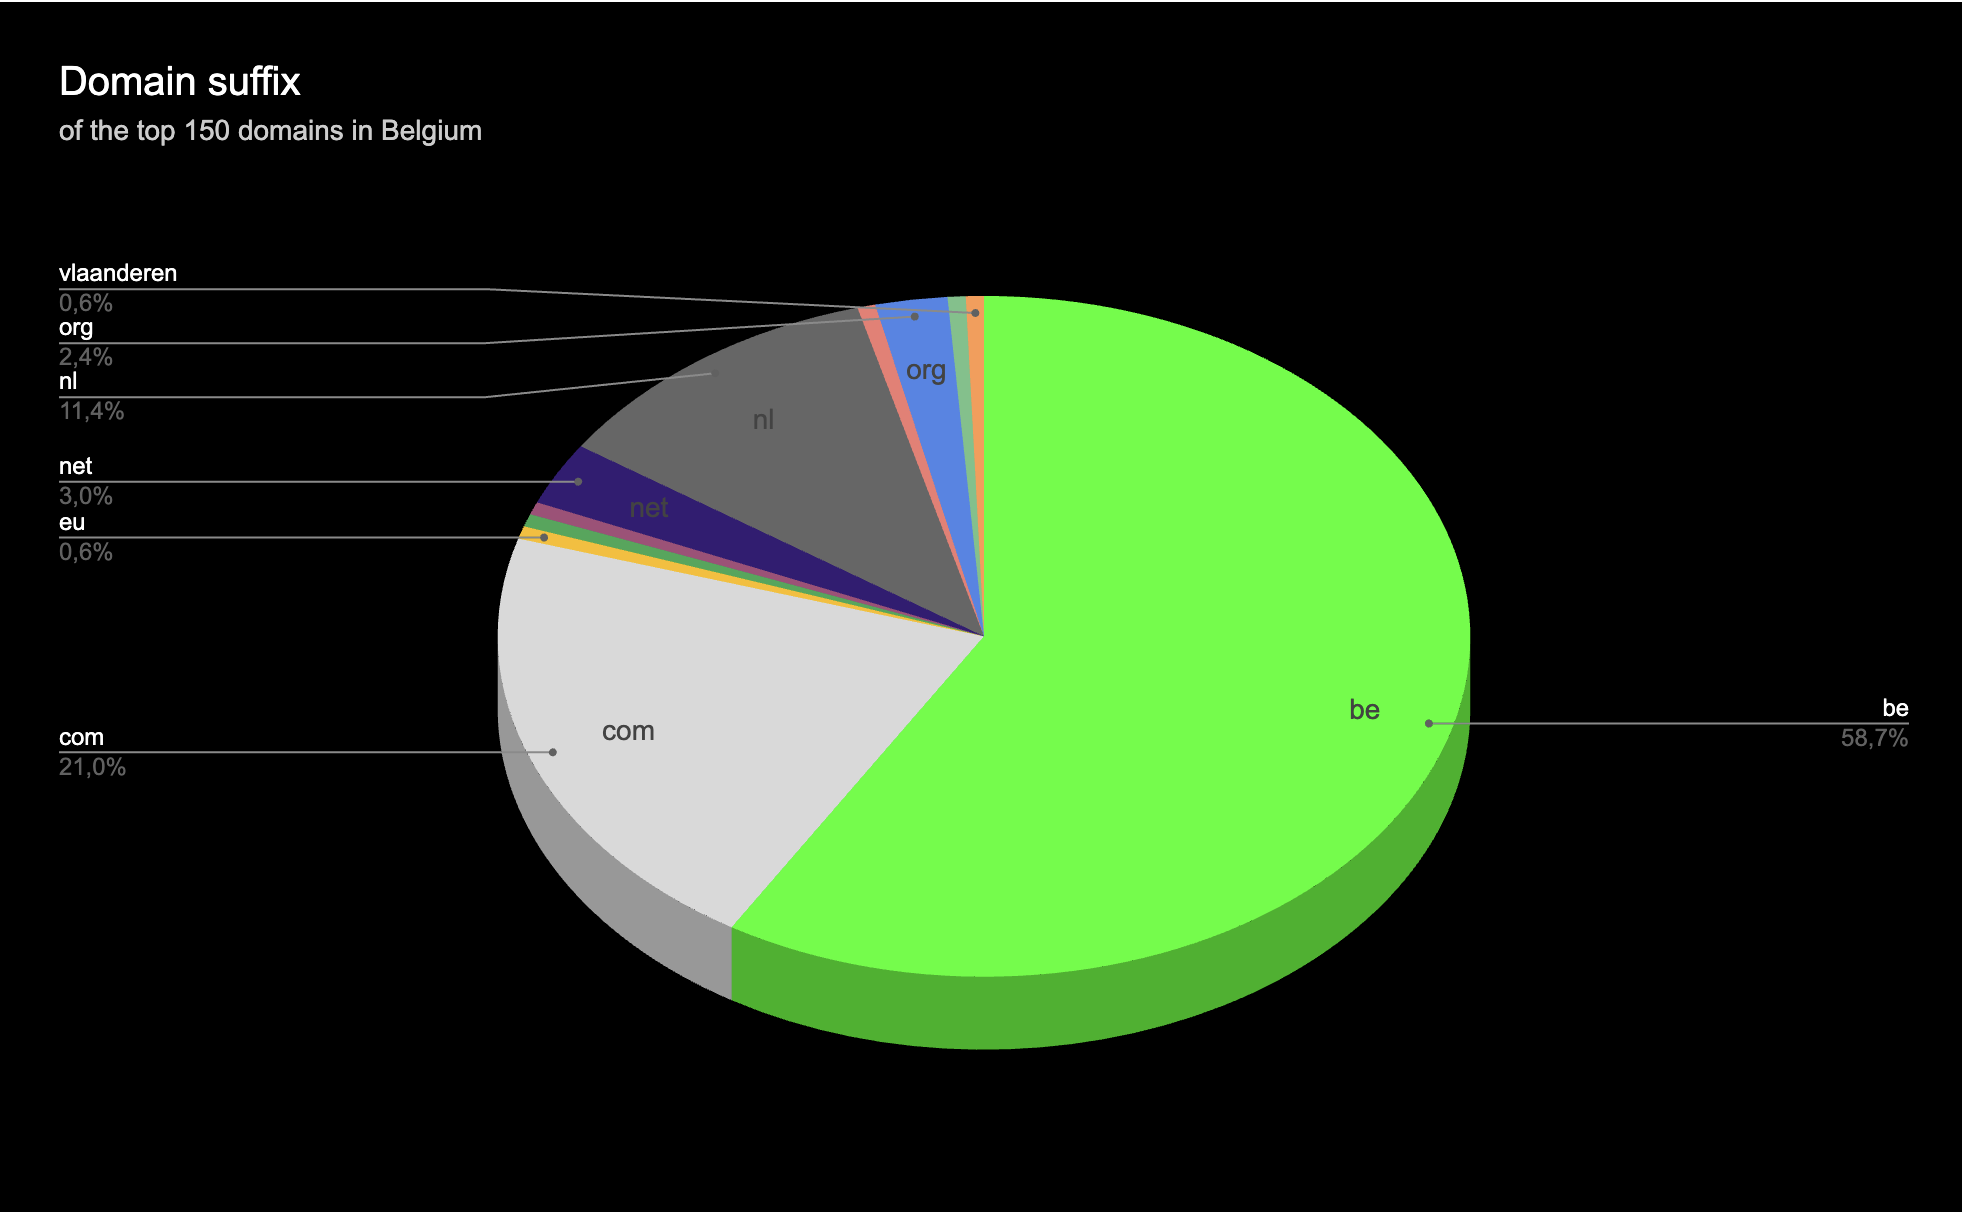
Suffix of the domain
In the top 150 domains in Belgium, we saw the following distribution for the domains:
Distribution of domain suffix of the top 150 domains with the most visibility through SEO in Belgium.
.be : 58,7%
.com : 21,0%
.nl : 11,4%
.net : 3%
.org : 2,4%
.eu : 0,6%
.vlaanderen : 0,6%
Others: 2,3%
The top 10 most visited .nl domains in Belgium in 2025
This is a list of the top 10 most visited websites that end in .nl.
Amazon's insane growth in the past few years, since their BE launch, is nothing short of incredible.
Amazon's growth in Belgium, visible through SISTRIX' visibility index
Other insights from the big players
No energy suppliers in the top 150 domains in terms of visibility, while these are historically large domains.
SSTRIX does not include all types of domains:
There aren't any gambling websites like napoleongames.be or scooore.be
There are also no gaming or adult content websites in the top 150 domains
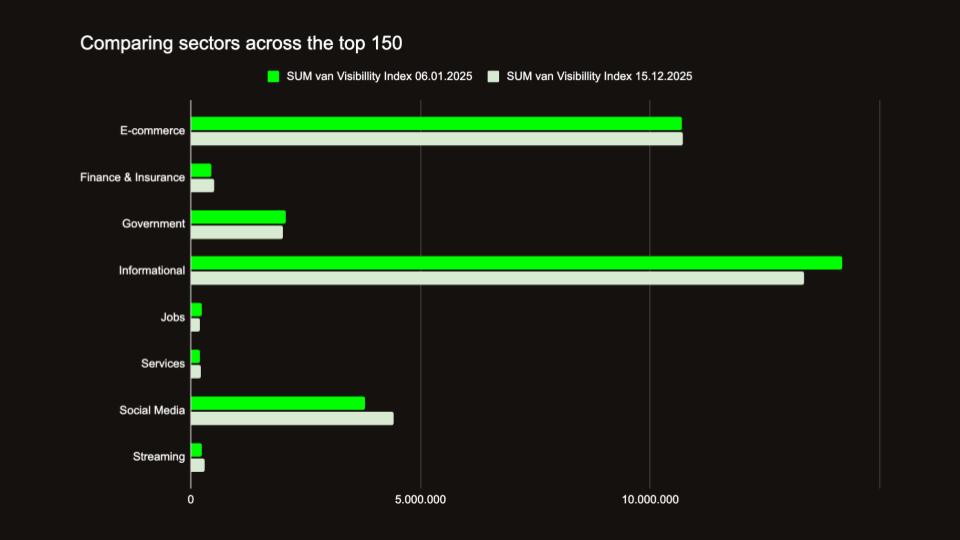
We see the biggest loss is visibility in information websites, while retail remains steady.
Perhaps, retailers put more effort in being aligned with the latest updates.
Sectoral differences in visibility of the top 150 domains in Belgium, calculated by the sum of visibility index (SISTRIX data) on the first available day in january and the 15th of december.
Tweakers deserves an honorable mention, even though informational websites in the top 150 saw a decrease in visbility of 5,83%, they were able to increase their visbility with 36,15%. Pushing them up 21 placesin the top 150. They went from position 64 to position 43.
The only two supermarkets with a declining position were ah.be (lost 48 positions) and jumbo.nl (lost 18 positions), two supermarkets with their roots in The Netherlands.
Conclusion
SEO in Belgium in 2025 rewarded relevance, real expertise, and content that closely matches user intent. Platforms built around discussion, strong category structures, and continuously updated content gained visibility, while generic reference sites and structurally weakened media platforms lost ground.
The key takeaway is that visibility growth is rarely accidental. Winners invested in indexable architecture, internal linking, and content formats that align with how Google evaluates usefulness today. Losers often suffered from duplication, outdated templates, or a mismatch between content depth and search intent.
For teams planning 2026, the lesson is clear: measure momentum, not just size, and treat technical SEO, content quality, and intent alignment as a single system rather than separate checklists.

.jpeg)